 Eben@CANSLIM Research
Institutional Analysis & Market Backdrop
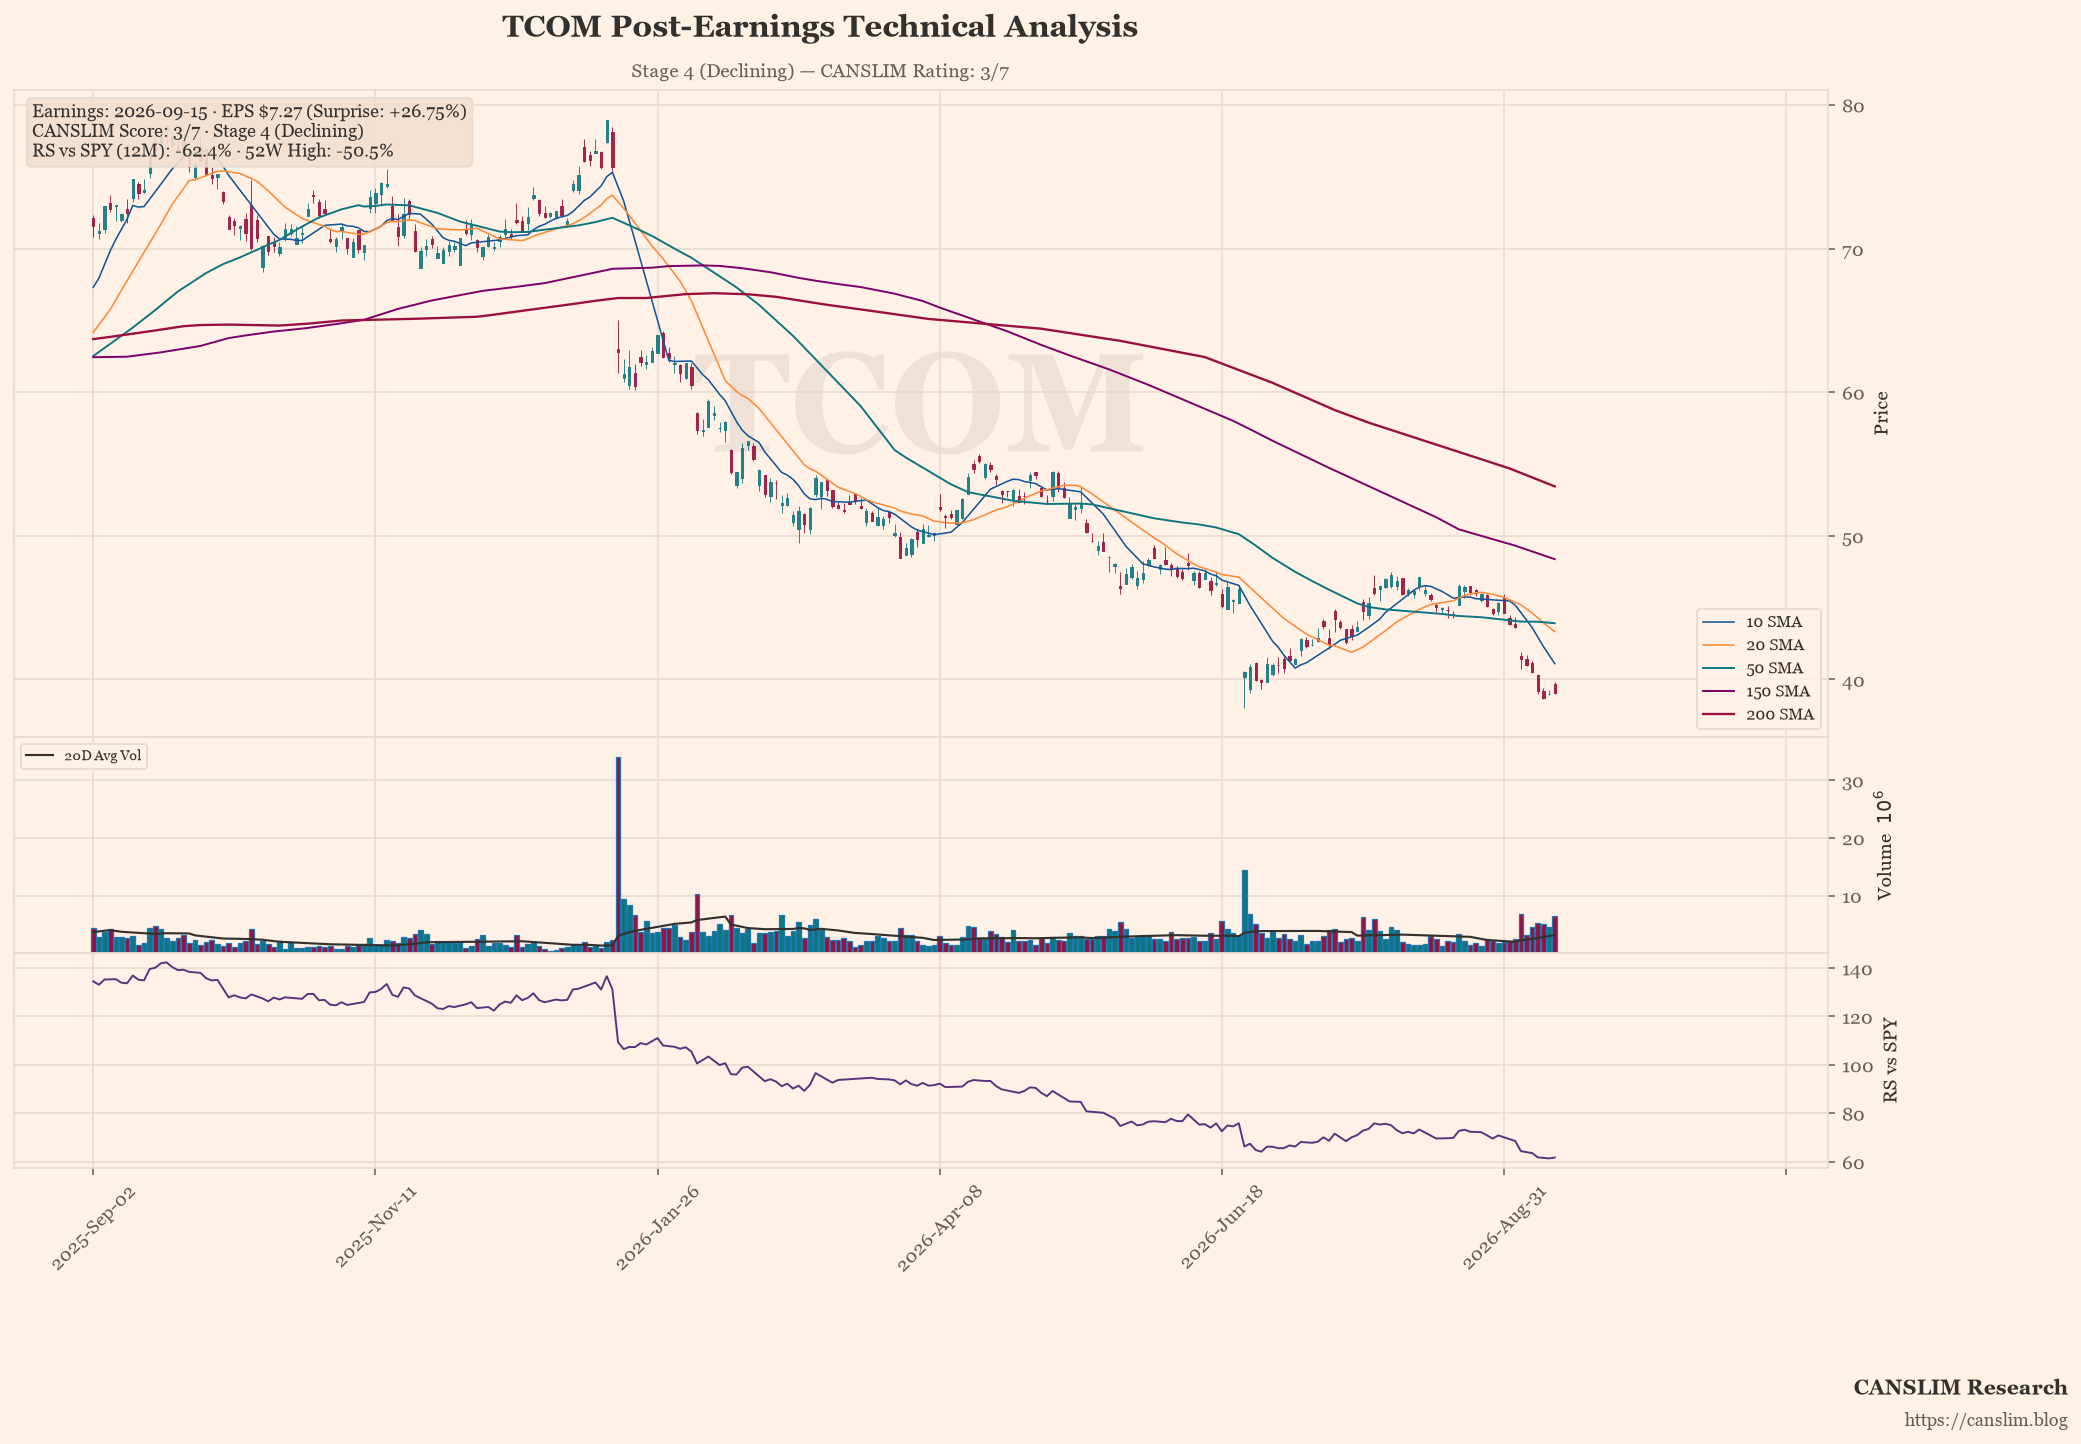
Tencent Holdings reported exceptional financial results on 15 September 2026, posting earnings per share of $7.27 against a consensus estimate of $5.74, representing a staggering 26.75% beat. This performance was underpinned by revenue growth of approximately 17.2% year-on-year, demonstrating the company’s continued ability to capitalise on its dominant position within China’s digital economy despite broader macroeconomic headwinds.
From a technical perspective, the market reaction has been muted, with the current share price of $39.08 trading well below both the 50-day moving average at $43.92 and the 200-day moving average at $53.45. While the fundamental data suggests strong momentum, the stock remains in Stage 4 (Declining) according to CANSLIM criteria, scoring only 3 out of 7 key indicators. Investors should note that the price is currently -50.6% below its recent high, indicating a significant correction that has yet to find support.
Institutional outlooks remain cautious given the divergent technical signals despite the earnings success. Forward catalysts include potential regulatory clarity in China’s tech sector and further monetisation of Tencent’s gaming portfolio, though operational risks persist regarding geopolitical tensions and local competition. Until the stock price reclaims key moving average support levels, the risk-reward profile for new capital remains skewed towards caution rather than aggressive accumulation.
Earnings & Quantitative Scorecard
| Key Metric | Reported / Current | Benchmark / Consensus | Status |
|---|---|---|---|
| Quarterly EPS (C) | $7.27 (+1% YoY) | $5.74 (Surprise: +26.8%) | Fail |
| Quarterly Revenue | $16.21B (+17.2% YoY) | Top-line Growth | Pass |
| Annual EPS Growth (A) | +181%/yr | ≥25% Annual CAGR | Pass |
| 52-Week High Range (N) | -50.5% off high | Within 15% of High | Lagging |
| Relative Strength (L) | -62.4% vs SPY | Positive Alpha | Fail |
| Institutional Float (I) | 26% | 30% – 90% Float Ownership | Neutral |
| Minervini Trend Template | 0 / 7 Criteria | Stage 2 Uptrend Alignment | Stage 4 (Declining) |
| Composite CANSLIM Rating | 3 / 7 Pillars | Institutional Quality Setup | 🔴 Lagging / Deteriorating |
Stage, pattern and sentiment labels are generated by rule-based approximations (Weinstein stage analysis, Minervini trend template and heuristic pattern detection), not by precise technical analysis. Data as of September 16, 2026. For informational and educational purposes only — not investment advice. Always verify against primary sources before making any investment decision.
Discover more from CANSLIM Research
Subscribe to get the latest posts sent to your email.