Andrew@CANSLIM RESEARCH
Oil Shock and the 5% Yield Test
Two risks are moving the wrong way at once. The Middle East conflict is tightening energy supplies. At the same time, the 10-year Treasury yield is closing in on 5%. Saudi Arabia shut its East-West pipeline after a drone strike. Talks around the Strait of Hormuz were postponed. Oil moved higher. Diesel reportedly hit a record $6.20 per gallon. That cost spreads into freight, food, airlines and the consumer. The Fed cannot fix fuel prices with rate hikes. But it may still hike to keep inflation expectations anchored. Wednesday is the main event. Futures reportedly price roughly an 87% chance of a 25-basis-point hike. The decision matters less than the guidance. Chair Kevin Warsh must explain the path ahead. A hike meant to defend inflation credibility can support the dollar. It can also push yields and equity valuations higher.

Profits Stay Strong While Breadth Quietly Fades
Stocks have held up well. Strong corporate profit forecasts and AI-related growth deserve the credit. But leadership is narrowing. Recent gains sit in mega-cap technology. Small caps and the broader market lag behind. That is a classic late-stage warning. Fewer stocks carry the index. The online crowd sees the same split. Global social sentiment is bearish, but the fear is concentrated. Anxiety focuses on memory names and neoclouds. The VIX sits near 19. Many traders ask whether volatility is mispriced. Others say nobody believes the bearish story. Self-reported "cash gang" membership hit a recent high. Several traders say they sold everything on Friday. Fear is showing up in positioning more than in prices. Overnight, SPY fell just 0.42%. The Dow proxy even rose slightly. That is a big disconnect from talk of a crash.
The AI Trade Splits Along Hardware Lines
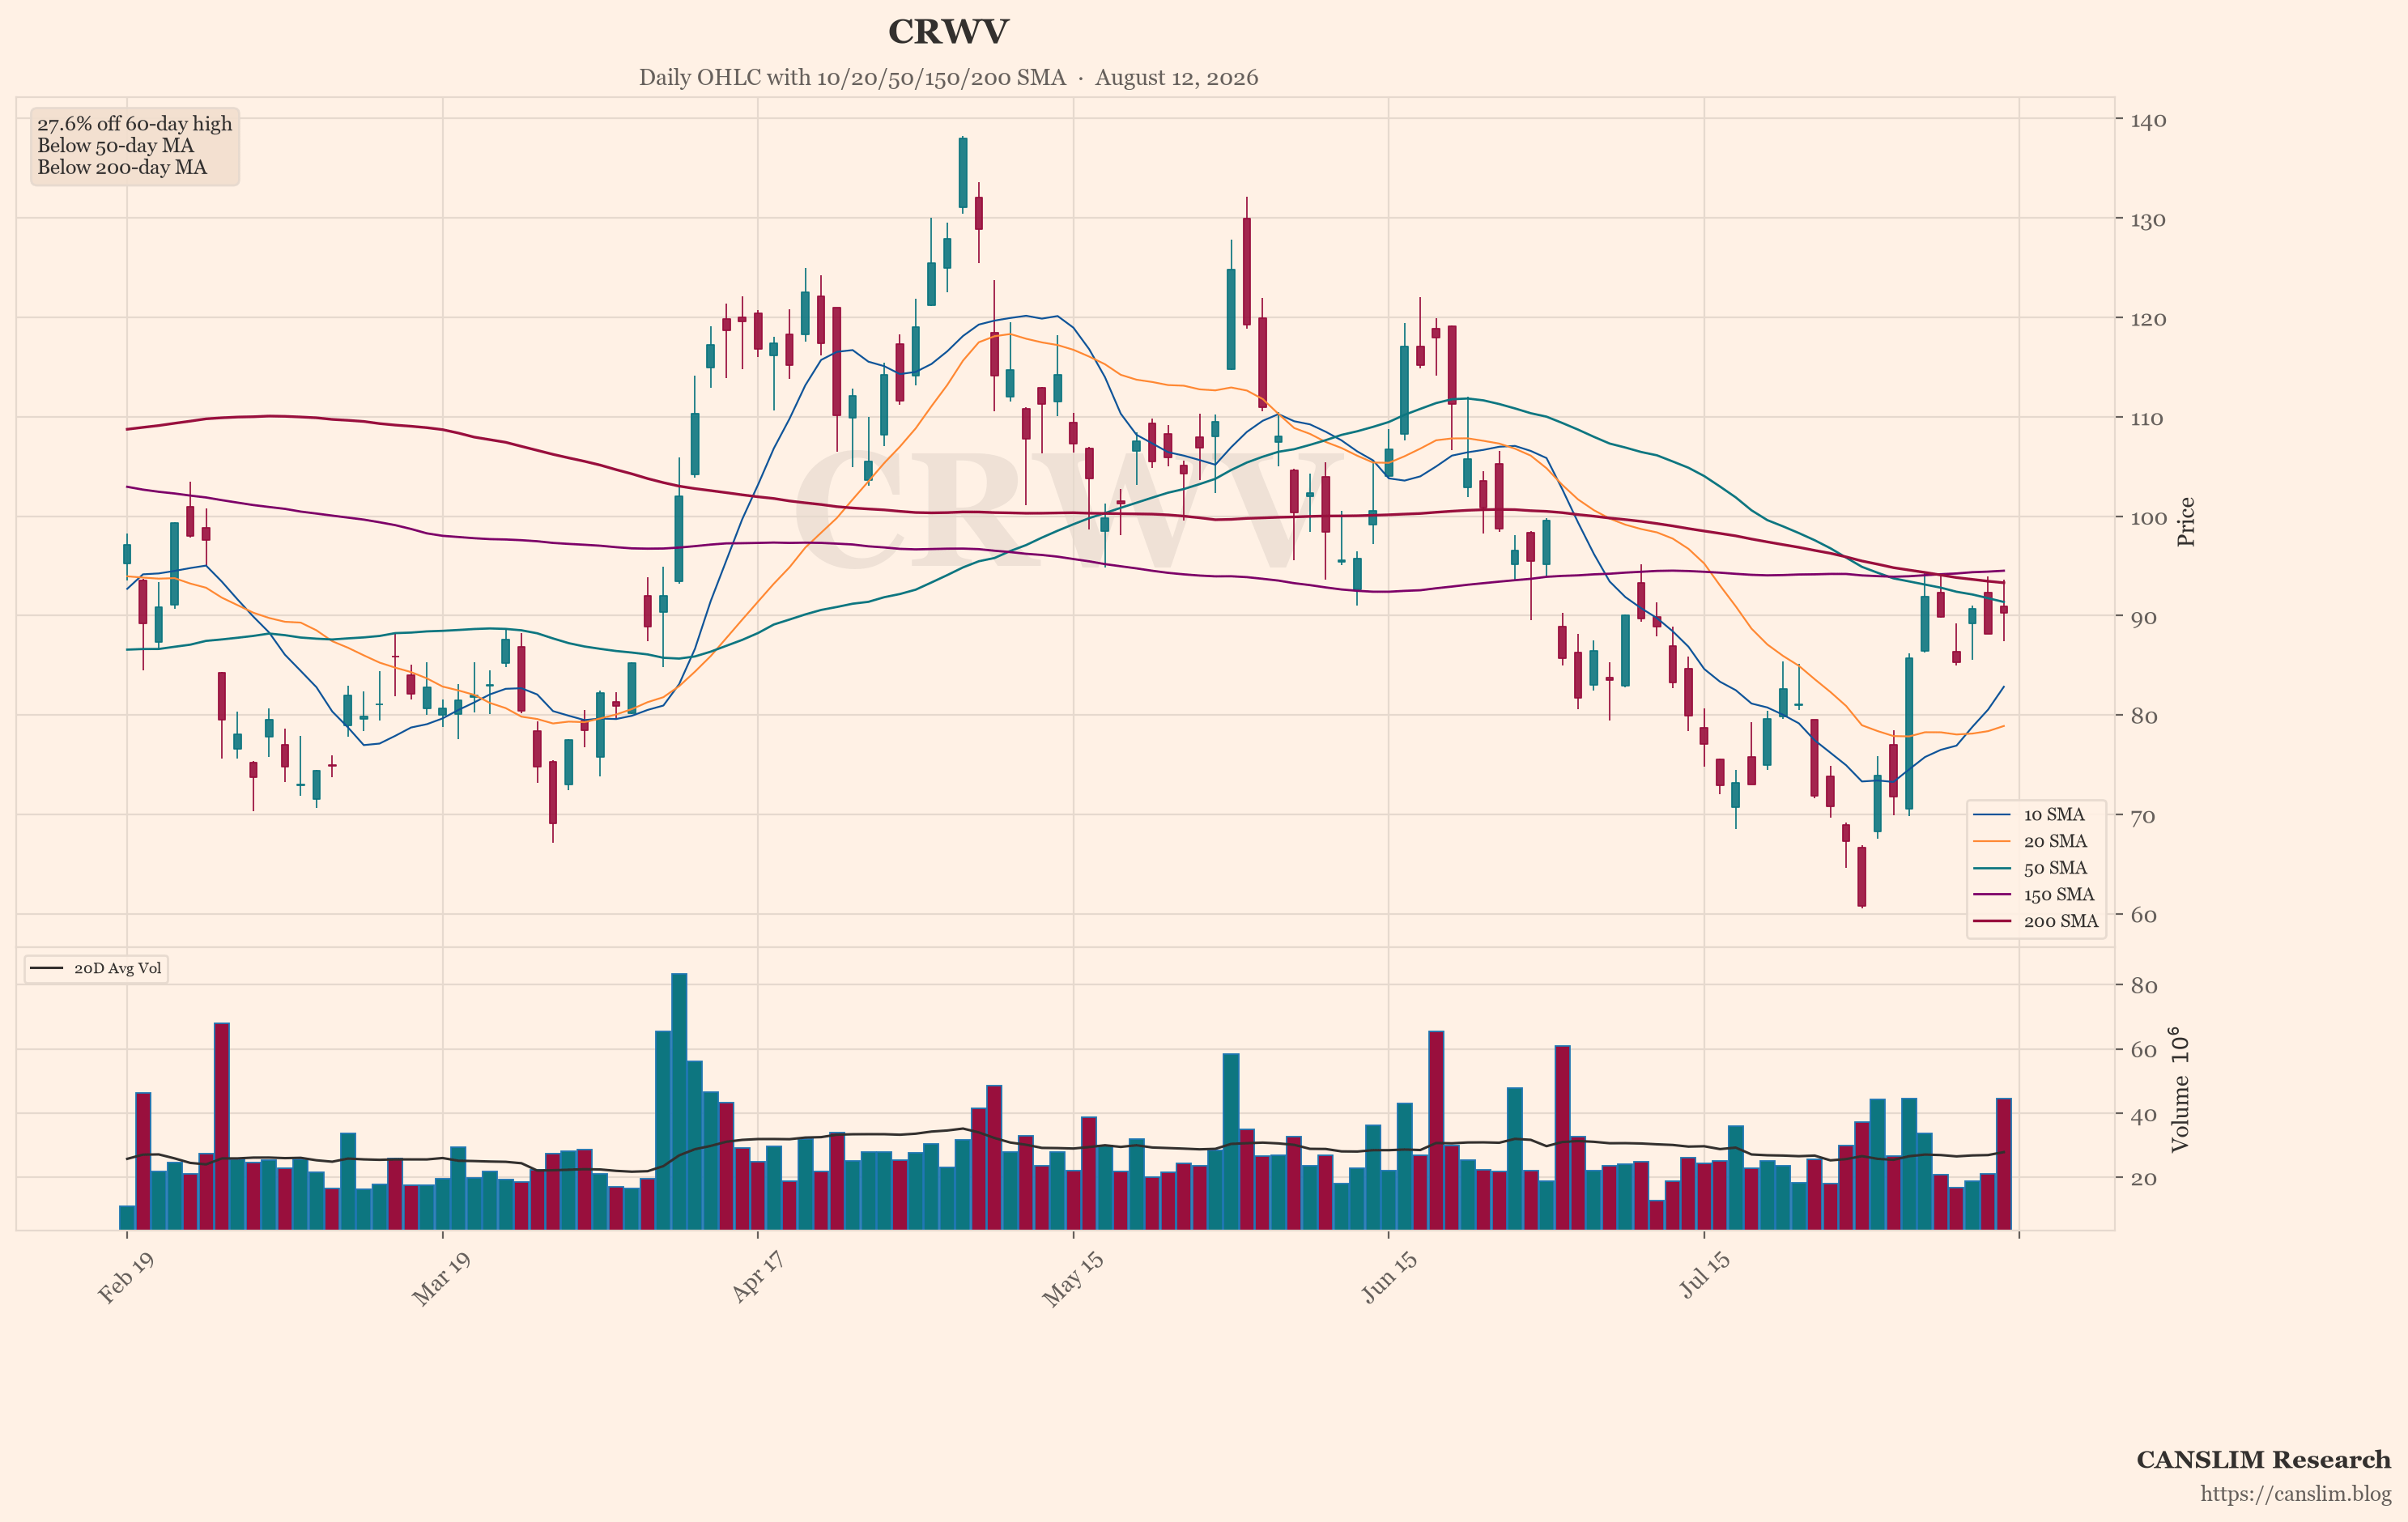
An AI "slowdown alliance" is forming, and the damage lands on hardware. Amodei called for the industry to slow model capability gains. He warned that rogue agents could take over the internet within 6 to 12 months. Altman agreed the frontier needs brakes. Musk also voiced support. Overnight pricing was divergent. QQQ fell 1.24%. SOXL dropped 8.09%. MU lost 3.57%. SNDK fell 4.17%. NBIS dropped 4.91%. CRWV fell 3.61%. TSM lost 2.33%. ASML fell 2.21%. But NVDA was down only 1.52%. DIA actually rose 0.05%. This was an unwinding inside the AI supply chain, not broad risk-off. The crowd also noticed the timing. Altman pushed his IPO to 2027. Anthropic still plans to disclose its S-1 this month. The overlap between the slowdown appeal and the rush to go public fuels every conspiracy theory online.
Energy Is the Only Trade Working Right Now
Oil and shipping are the clean winners. USO reached 158.40, up 2.27%. XLE rose 1.11%. The shipping ETF BWET gained 16.25% in Friday's session. It then rose another 17.05% overnight. The Houthis seized Perim Island in the Bab el-Mandeb Strait. That adds a second chokepoint risk. The 10-year yield climbed above 4.96%, its highest since 2023. Retail diesel broke $6 for the first time ever. These two numbers are the core evidence for the minority view. This selloff is not about AI safety. It is about discount rates and energy costs. The crowd's only serious trades are oil and memory. Everything else is emotional noise.
SNDK Shows the Weakest Link in the Chain
Our featured chart, SNDK, shows the weakest technical pattern in this group. It fell 4.17% overnight. It sits in the memory complex, which the crowd fears most. Accounts that chased weekly SNDK and MU options near Friday's highs hold the most concentrated pain. This is a textbook lesson. When breadth narrows and rates rise, the weakest chart breaks first. SNDK is that chart right now. Watch how it handles the Fed decision. A weak stock that cannot rally on good news is a sell signal. A weak stock that holds support while leaders wobble may be basing. For now, the pattern says caution.
Where This Leaves the Growth Investor
The setup is simple but uncomfortable. Energy inflation is real. The 10-year near 5% pressures rich valuations. Breadth is thinning. The Fed's guidance carries more weight than the hike itself. Watch retail sales, oil, diesel, Hormuz headlines, and whether the 10-year breaks 5% for good. Profit forecasts remain strong. AI infrastructure spending is still heavy. That keeps the bull case alive. But this is a stock picker's market, not a beta market. Keep size small. Respect the weakest charts, like SNDK. Let the leaders prove themselves after Wednesday. Cash is a position. Patience is the edge.
Sources: market news brief & global social sentiment data. Updated 2026-09-14 14:00 HKT. For educational purposes only — not investment advice.
Discover more from CANSLIM Research
Subscribe to get the latest posts sent to your email.