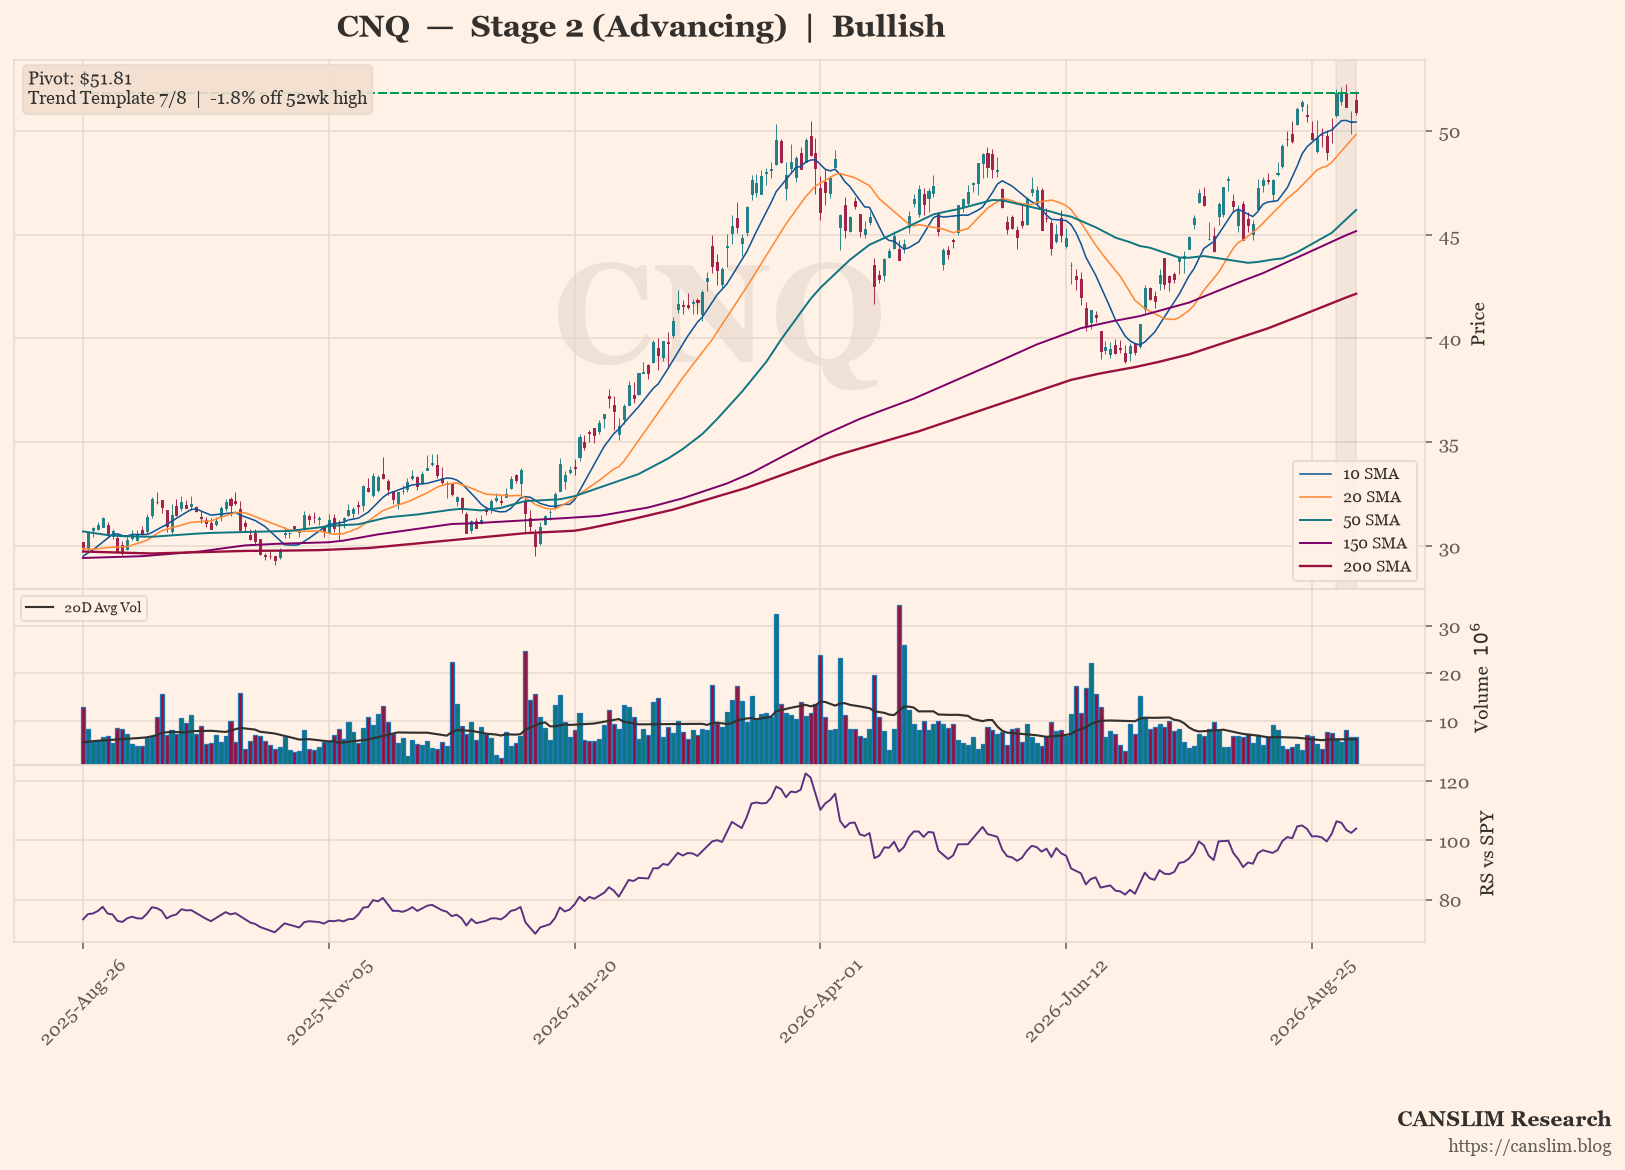
CNQ is trading at 50.90, just 1.8 percent below its 52-week high and 73.6 percent above its yearly low, with price holding above a rising 30-week moving average. The market focus is on the absence of any real base, as the stock sits at or near highs with only a shallow 2.6 percent one-week pause rather than a proper consolidation or VCP. Overall sentiment is bullish, with seven of eight trend template checks passing and an offensive Stage 2 setup in place.
As of 2026-09-08 · Close $50.9
Stage 2 (Advancing) — Price holding above a rising 30-week MA — uptrend intact (30-week MA 6-week slope: 5.05%)
Continue Reading
This article is for pass holders.
Most Flexible
30-Day Pass$12.00One-time purchase · no auto-renewalBuy 30 DaysSave $24.00
365-Day Pass$120.00$144.00One-time purchase · no auto-renewalBuy 365 Days
30-Day Pass$12.00One-time purchase · no auto-renewalBuy 30 DaysSave $24.00
365-Day Pass$120.00
Already a pass holder? Sign in · Continue with Google