 Eben@CANSLIM Research
Institutional Analysis & Market Backdrop
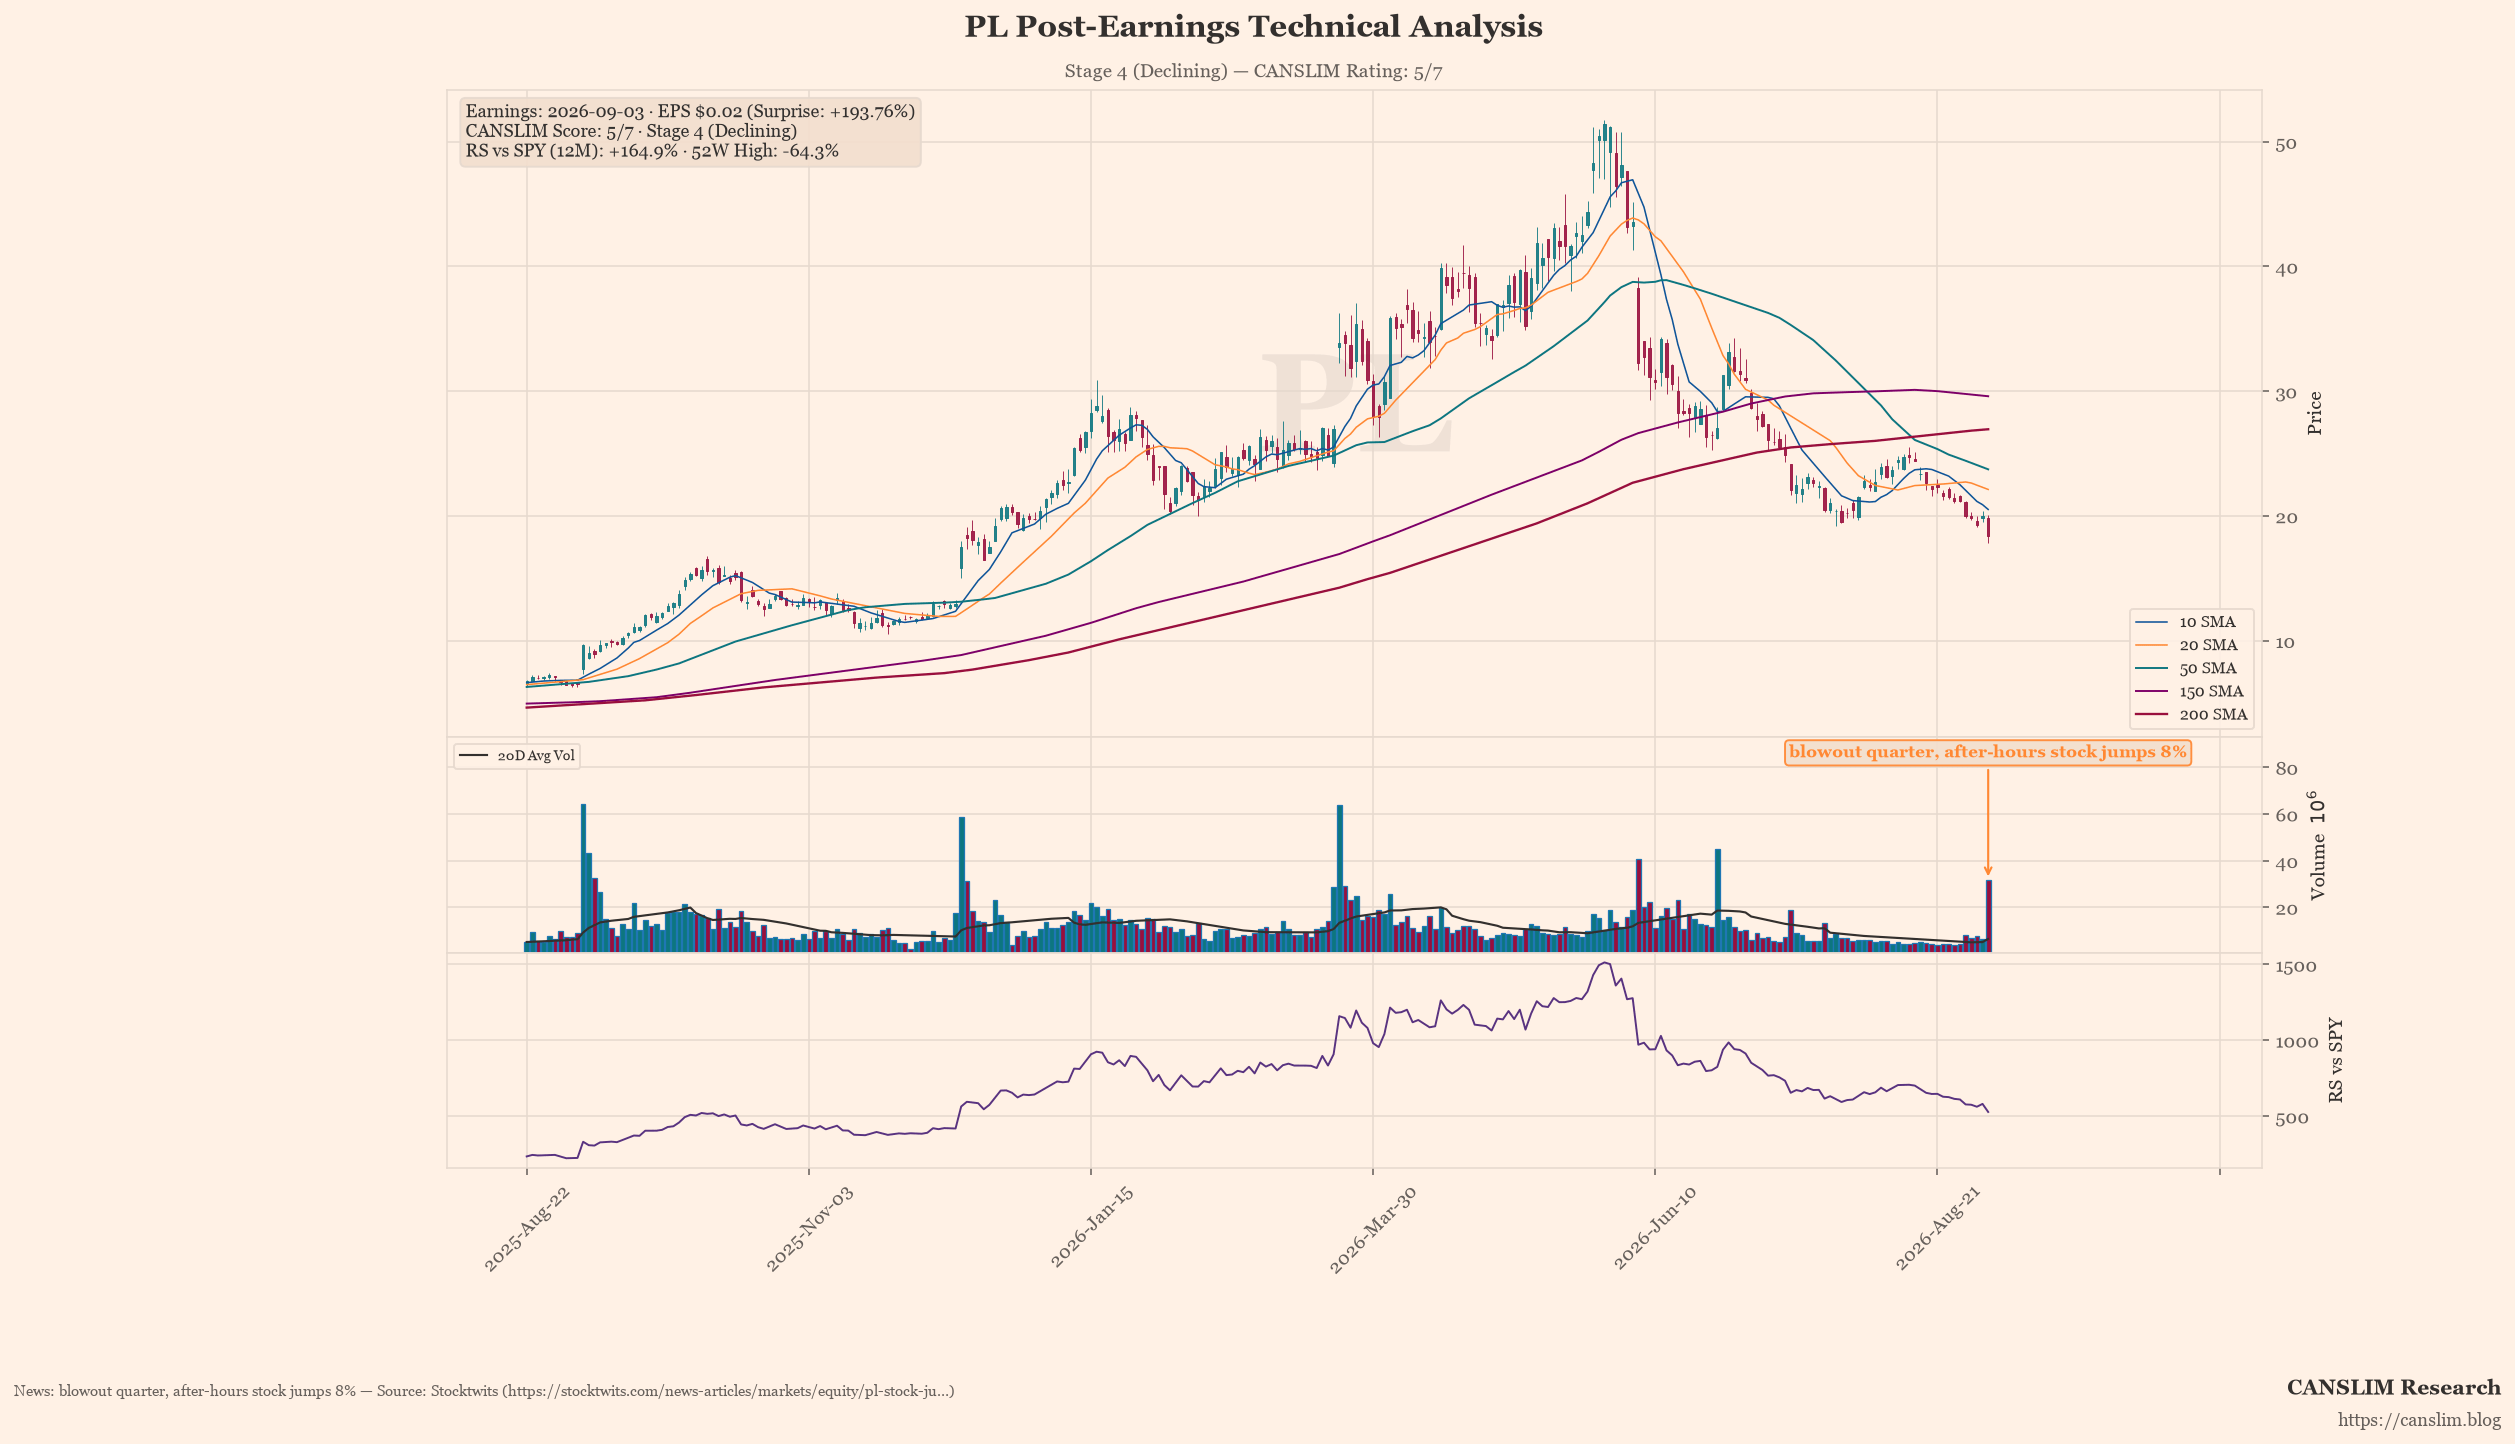
Plumbers Unlimited reported earnings that exceeded analyst expectations by nearly double, posting an EPS of $0.02 against a consensus of -$0.02. This substantial surprise was driven primarily by robust year-over-year revenue growth of over 42%, indicating strong underlying demand despite the challenging macroeconomic backdrop. While the fundamental data suggests operational momentum is accelerating, the market’s reaction has been muted, reflecting significant uncertainty regarding the sustainability of this growth trajectory.
From a technical perspective, PL is currently in Stage 4 (Declining), trading at $18.35 which sits well below both the 50-day moving average ($23.73) and the 200-day moving average ($26.94). The stock has fallen 64% from its recent high, signalling a prolonged bearish trend that currently outweighs the earnings catalyst. Institutional CANSLIM alignment remains weak at 5/7, with price action failing to reclaim critical support levels, suggesting that further downside may be required before a technical reversal occurs.
Looking ahead, institutional investors should monitor for forward catalysts such as potential guidance revisions or new contract wins that could validate the revenue growth narrative. However, operational risks persist given the current downtrend and the distance from key moving averages. Until PL demonstrates resilience by closing above the 50-day MA or shows signs of a Stage 3 transition, the short-to-medium term outlook remains cautious, with the immediate focus on capital preservation rather than aggressive accumulation.
Earnings & Quantitative Scorecard
| Key Metric | Reported / Current | Benchmark / Consensus | Status |
|---|---|---|---|
| Quarterly EPS (C) | $0.02 (+200% YoY) | $-0.02 (Surprise: +193.8%) | Pass |
| Quarterly Revenue | $94.2M (+42.1% YoY) | Top-line Growth | Pass |
| Annual EPS Growth (A) | N/A | ≥25% Annual CAGR | Fail |
| 52-Week High Range (N) | -64.3% off high | Within 15% of High | Lagging |
| Relative Strength (L) | +164.9% vs SPY | Positive Alpha | Pass |
| Institutional Float (I) | 85% | 30% – 90% Float Ownership | Pass |
| Minervini Trend Template | 3 / 7 Criteria | Stage 2 Uptrend Alignment | Stage 4 (Declining) |
| Composite CANSLIM Rating | 5 / 7 Pillars | Institutional Quality Setup | 🟡 Developing / Watchlist |
Stage, pattern and sentiment labels are generated by rule-based approximations (Weinstein stage analysis, Minervini trend template and heuristic pattern detection), not by precise technical analysis. Data as of September 04, 2026. For informational and educational purposes only — not investment advice. Always verify against primary sources before making any investment decision.
Discover more from CANSLIM Research
Subscribe to get the latest posts sent to your email.