 Eben@CANSLIM Research
Institutional Analysis & Market Backdrop
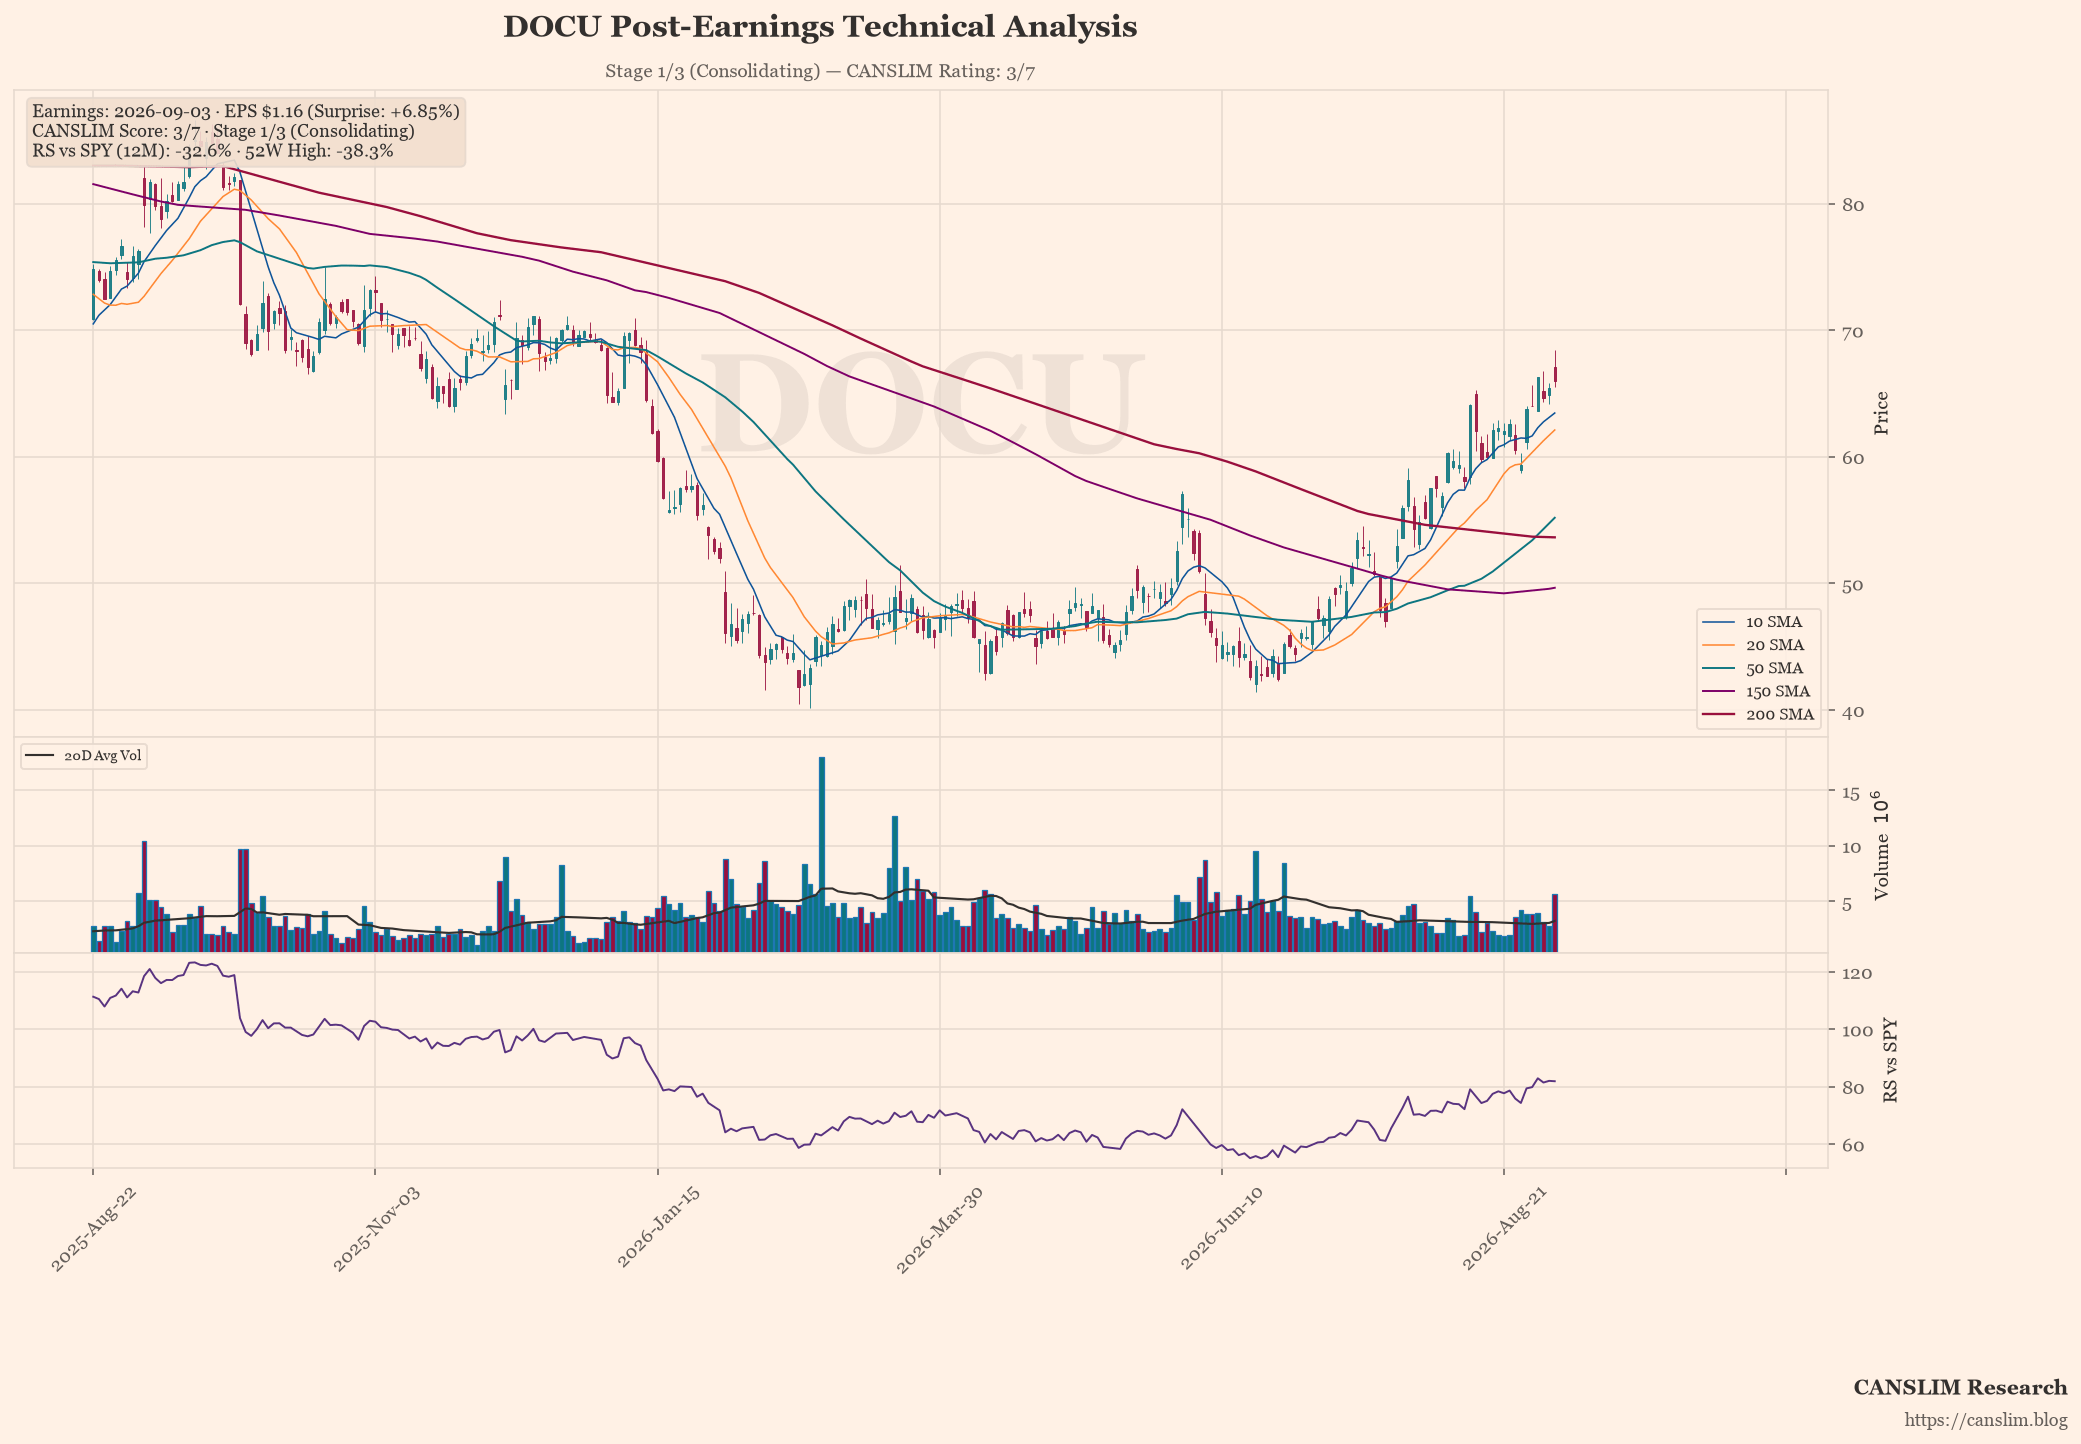
DocuSign reported fiscal third-quarter results that exceeded Wall Street expectations, posting earnings per share of $1.16 against a consensus estimate of $1.09. This represents a robust 6.85% beat, underpinned by revenue growth of 8.7% year-on-year to approximately $8.7 billion. The company’s ability to maintain pricing power while stabilising its customer base has been the primary driver of this performance, signalling a return to sustainable profitability following years of aggressive investment.
From a technical perspective, the stock is currently trading at $65.97, which sits well below the 50-day moving average of $55.17 and the 200-day moving average of $53.62. While this indicates a significant pullback from recent highs (-38.34%), the price remains above critical support levels, suggesting that the decline may be viewed by institutional investors as a buying opportunity rather than a trend reversal. The current CANSLIM score of 3 out of 7 points reflects the company’s status in Stage 1 of its three-stage growth cycle, where capital allocation and operational efficiency are prioritised over rapid expansion.
Looking ahead, DocuSign faces several forward catalysts including potential new enterprise contract wins and continued optimisation of its AI-driven document processing capabilities. However, investors should remain vigilant regarding operational risks such as macroeconomic headwinds affecting large corporate spending and the ongoing integration of legacy systems into its modernised platform. The management team’s focus on margin improvement suggests that future earnings will depend heavily on sustaining this disciplined approach to cost management.
Earnings & Quantitative Scorecard
| Key Metric | Reported / Current | Benchmark / Consensus | Status |
|---|---|---|---|
| Quarterly EPS (C) | $1.16 (+26% YoY) | $1.09 (Surprise: +6.8%) | Pass |
| Quarterly Revenue | $830.2M (+8.7% YoY) | Top-line Growth | Pass |
| Annual EPS Growth (A) | N/A | ≥25% Annual CAGR | Fail |
| 52-Week High Range (N) | -38.3% off high | Within 15% of High | Lagging |
| Relative Strength (L) | -32.6% vs SPY | Positive Alpha | Fail |
| Institutional Float (I) | 94% | 30% – 90% Float Ownership | Neutral |
| Minervini Trend Template | 4 / 7 Criteria | Stage 2 Uptrend Alignment | Stage 1/3 (Consolidating) |
| Composite CANSLIM Rating | 3 / 7 Pillars | Institutional Quality Setup | 🔴 Lagging / Deteriorating |
Stage, pattern and sentiment labels are generated by rule-based approximations (Weinstein stage analysis, Minervini trend template and heuristic pattern detection), not by precise technical analysis. Data as of September 04, 2026. For informational and educational purposes only — not investment advice. Always verify against primary sources before making any investment decision.
Discover more from CANSLIM Research
Subscribe to get the latest posts sent to your email.