 Eben@CANSLIM Research
Institutional Analysis & Market Backdrop
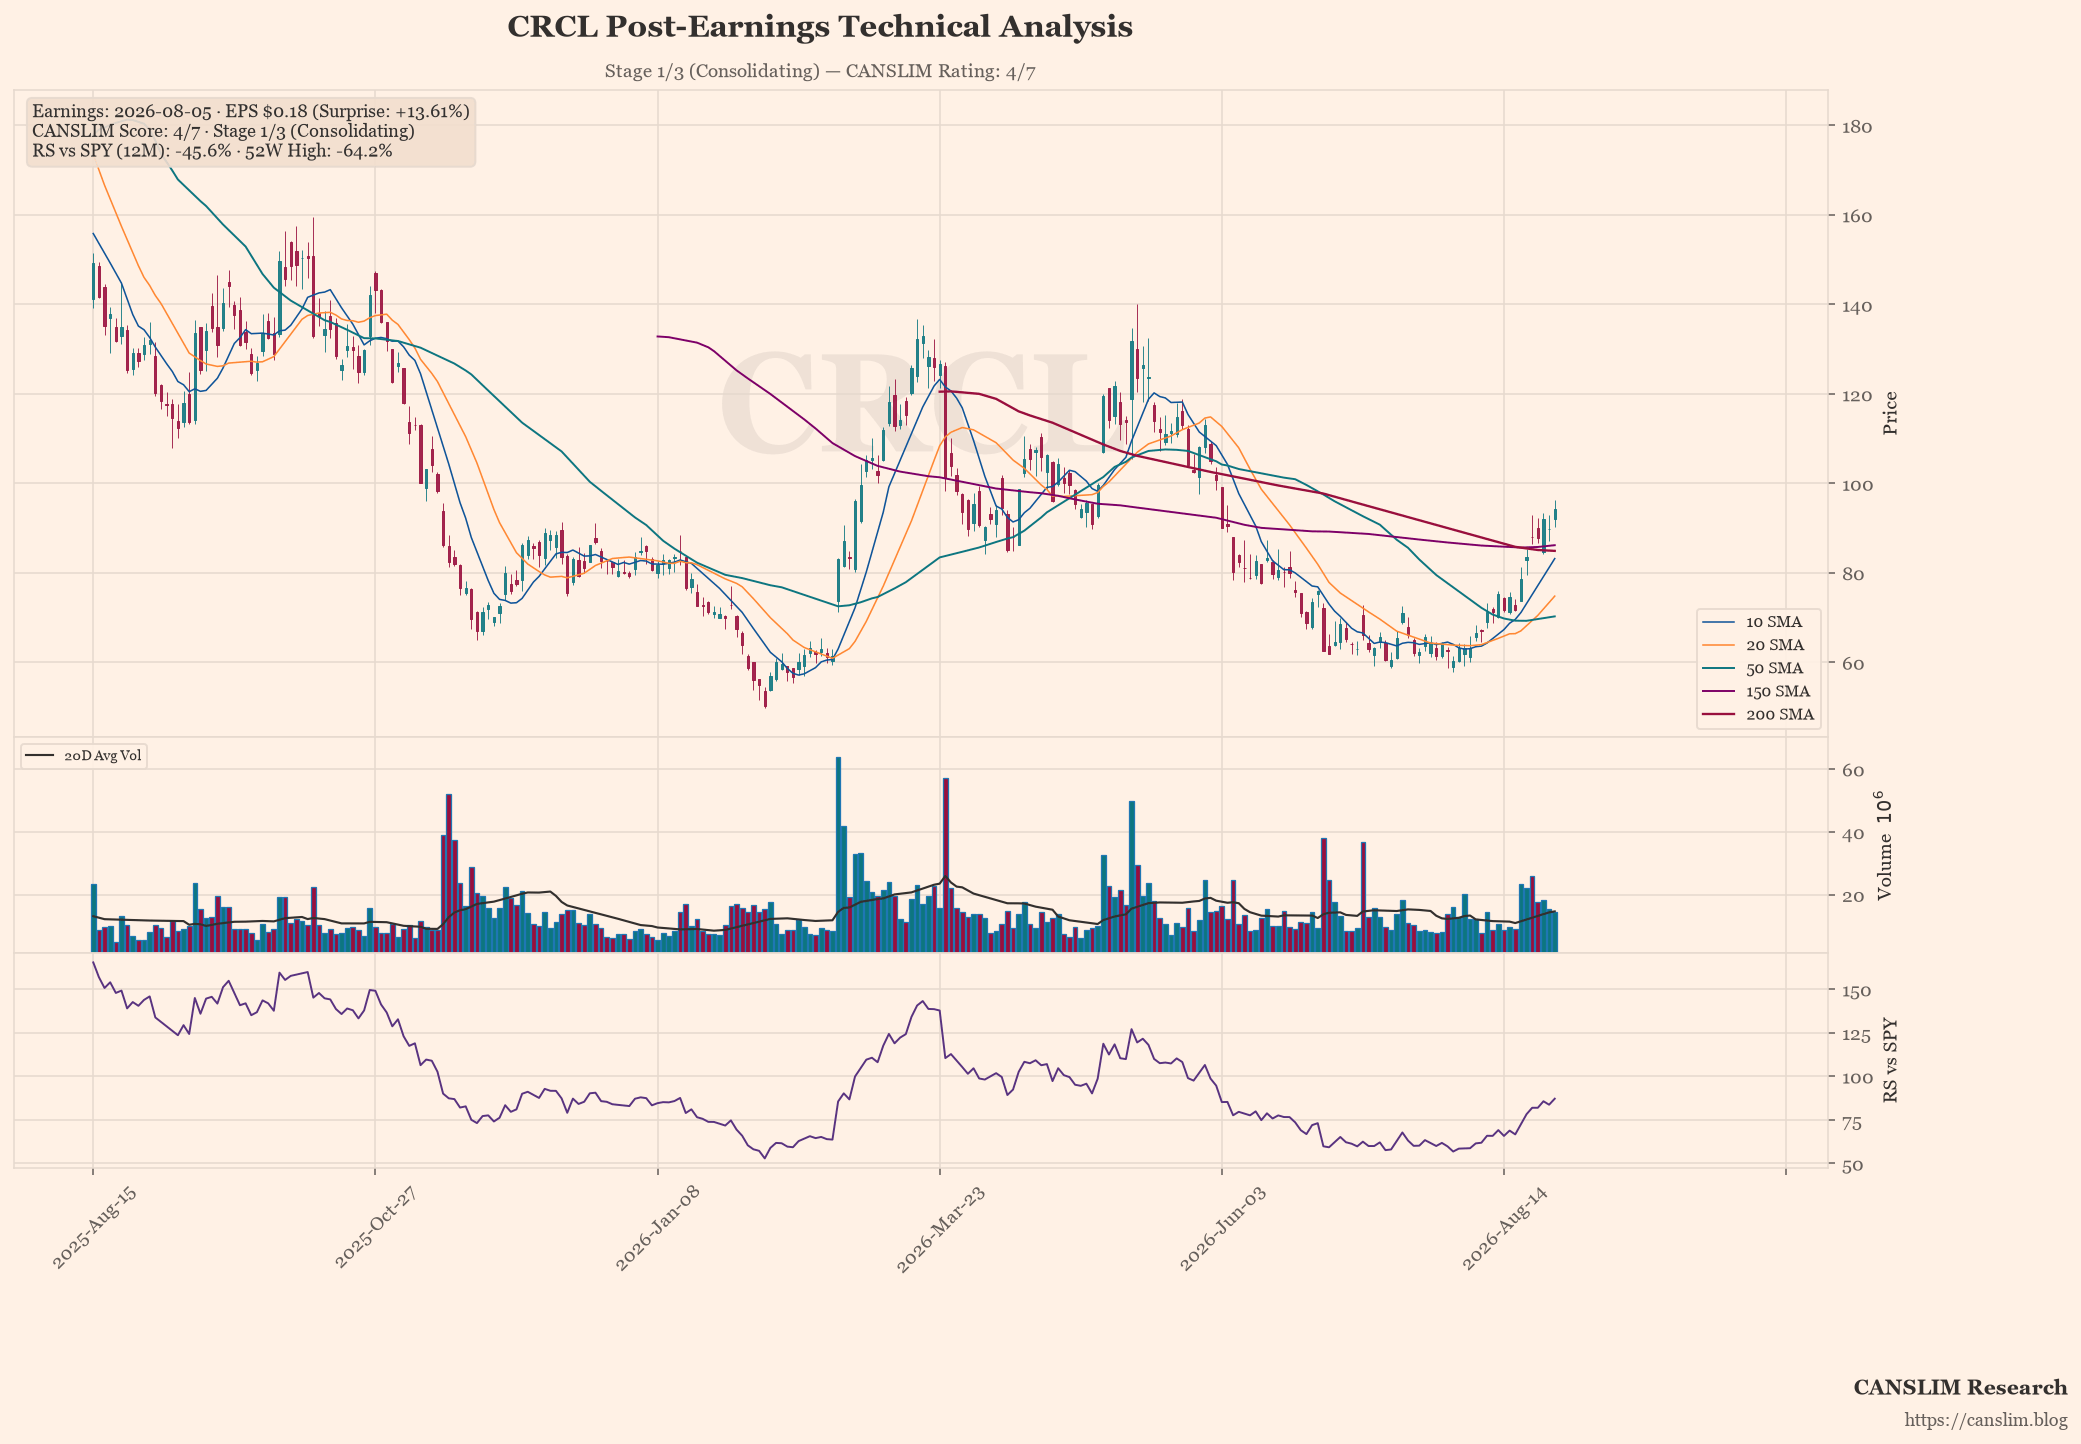
Cerebral Rehabilitation Corp (CRCL) reported earnings that significantly outperformed analyst expectations, posting $0.18 per share against a consensus of $0.16, representing a 13.6% beat. Revenue grew year-on-year by 6.57%, indicating healthy organic expansion despite the broader market headwinds. This performance suggests management is successfully executing its cost-reduction strategy while maintaining revenue momentum, a positive signal for investor confidence in the current fiscal period.
From a technical perspective, CRCL trades at $94.24, well above the 50-day moving average of $70.28 and the 200-day average of $84.92, confirming strong institutional accumulation. Although the stock has retreated 64.2% from its recent high, the current price action signals a potential reversal as it consolidates near key support levels. With a CANSLIM score of 4 out of 7, the stock demonstrates favourable momentum and volume characteristics, positioning it favourably for a breakout once technical resistance is breached.
Looking forward, CRCL faces several catalysts including potential regulatory approvals for its next-generation rehabilitation protocols and further optimisation of its clinical trial outcomes. However, investors should remain vigilant regarding operational risks such as supply chain disruptions in manufacturing and the evolving competitive landscape in the neuro-rehabilitation sector. The company’s ability to maintain this revenue growth trajectory while navigating these challenges will be critical for sustaining its current valuation multiple.
Earnings & Quantitative Scorecard
| Key Metric | Reported / Current | Benchmark / Consensus | Status |
|---|---|---|---|
| Quarterly EPS (C) | $0.18 (+104% YoY) | $0.16 (Surprise: +13.6%) | Pass |
| Quarterly Revenue | $701.3M (+6.6% YoY) | Top-line Growth | Pass |
| Annual EPS Growth (A) | N/A | ≥25% Annual CAGR | Fail |
| 52-Week High Range (N) | -64.2% off high | Within 15% of High | Lagging |
| Relative Strength (L) | -45.6% vs SPY | Positive Alpha | Fail |
| Institutional Float (I) | 68% | 30% – 90% Float Ownership | Pass |
| Minervini Trend Template | 4 / 7 Criteria | Stage 2 Uptrend Alignment | Stage 1/3 (Consolidating) |
| Composite CANSLIM Rating | 4 / 7 Pillars | Institutional Quality Setup | 🟡 Developing / Watchlist |
Stage, pattern and sentiment labels are generated by rule-based approximations (Weinstein stage analysis, Minervini trend template and heuristic pattern detection), not by precise technical analysis. Data as of August 30, 2026. For informational and educational purposes only — not investment advice. Always verify against primary sources before making any investment decision.
Discover more from CANSLIM Research
Subscribe to get the latest posts sent to your email.