 Eben@CANSLIM Research
Institutional Analysis & Market Backdrop
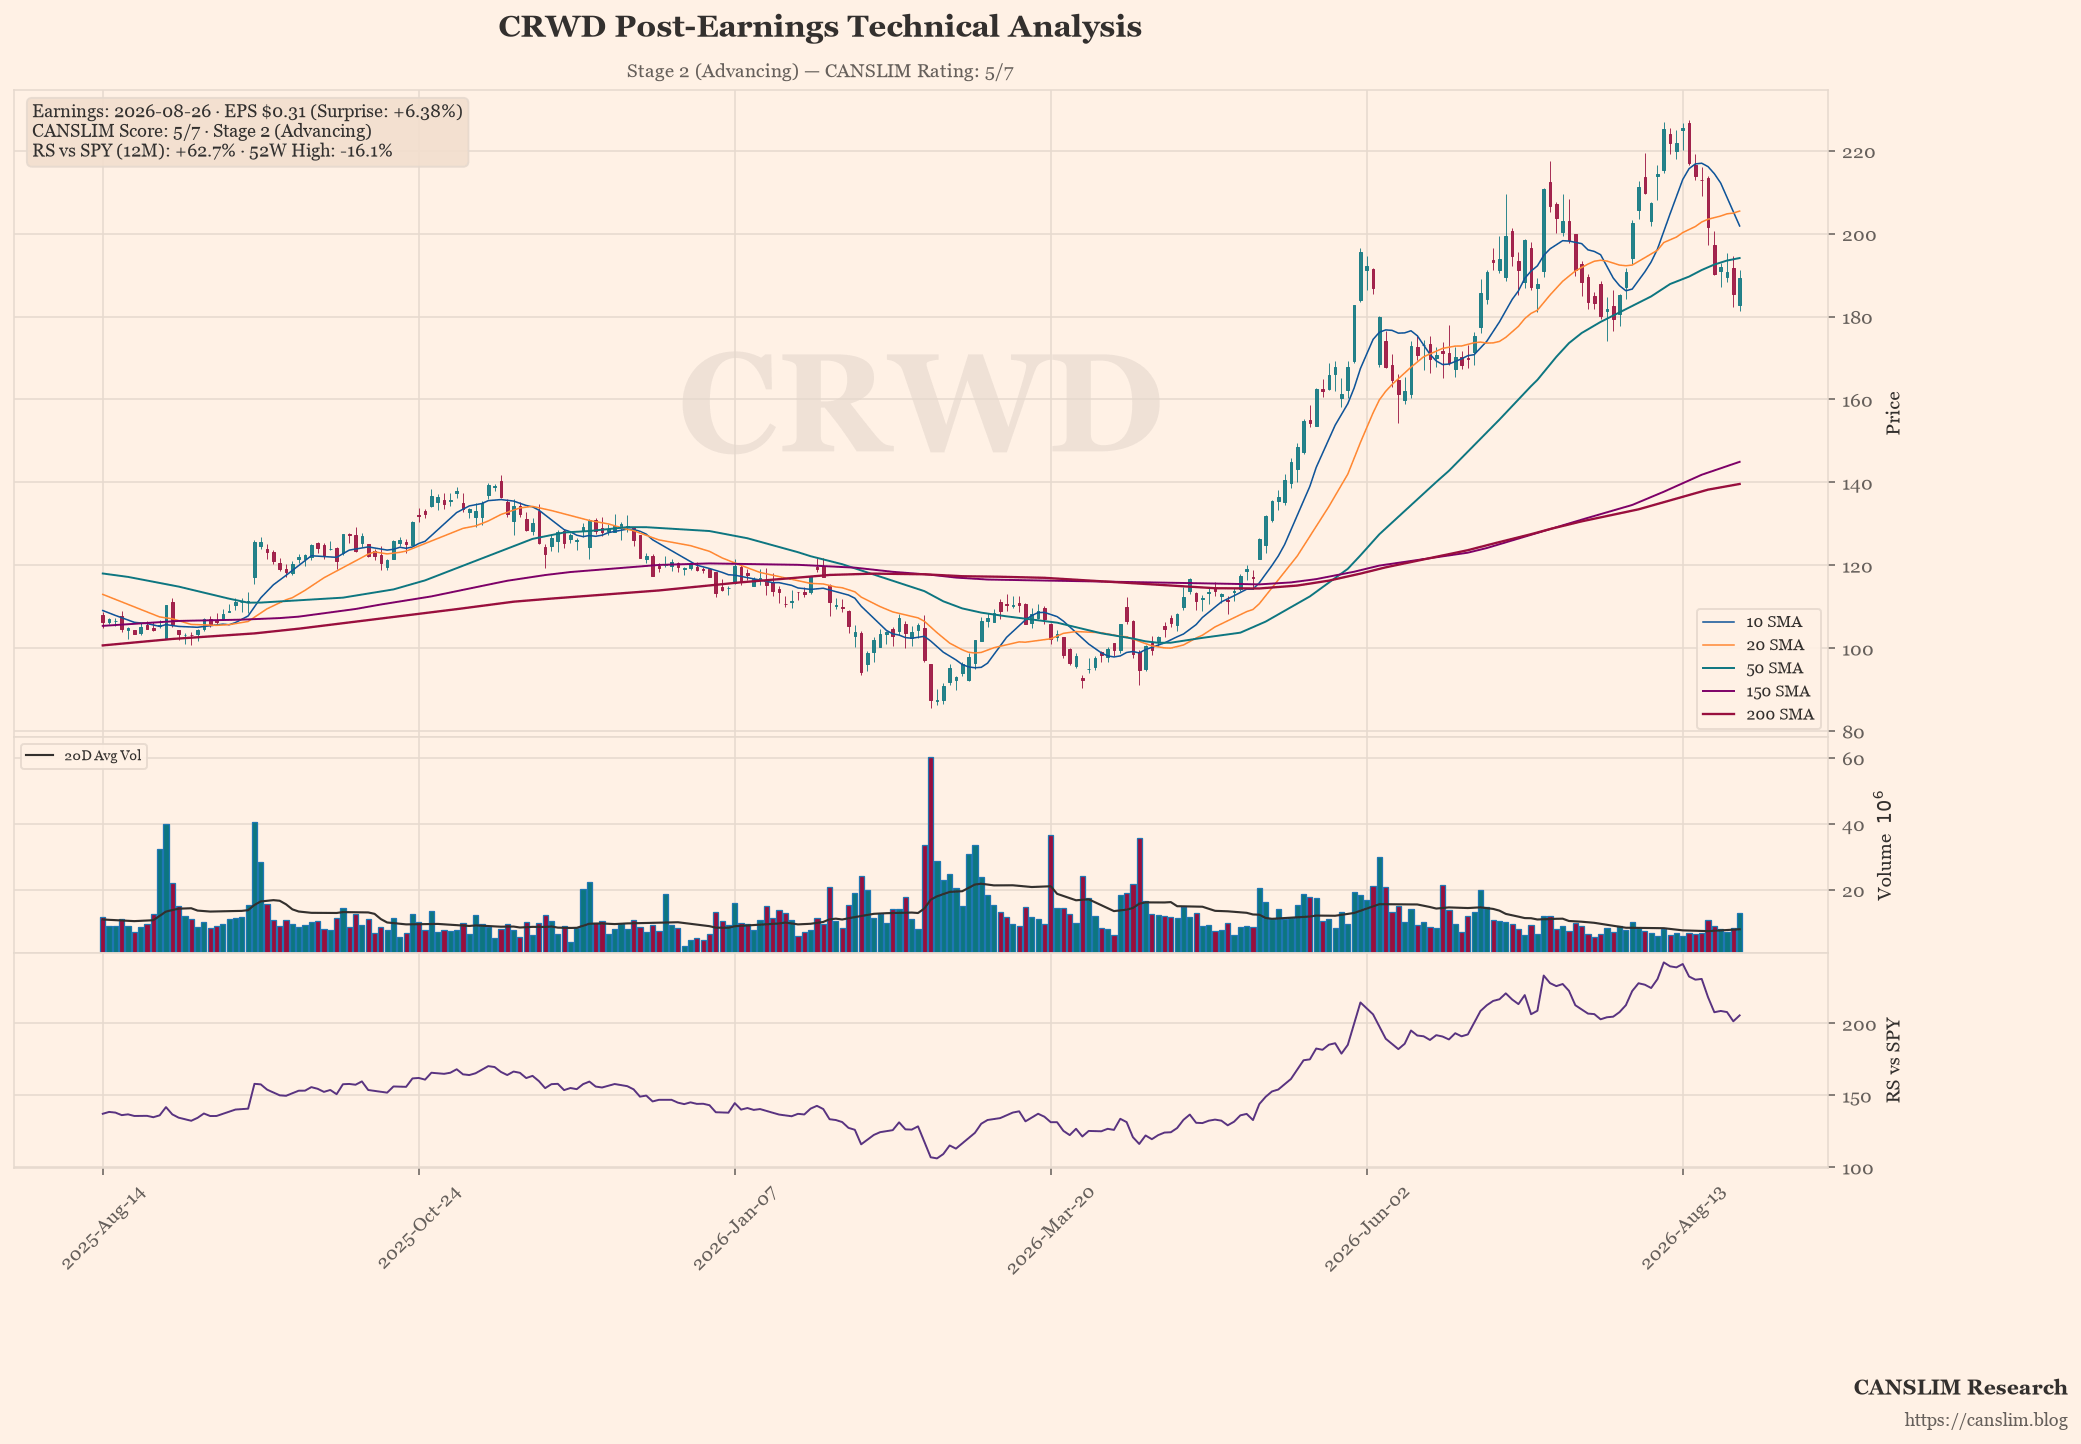
Cloudflare (CRWD) has reported Q3 results that significantly outperformed Wall Street expectations, delivering $0.31 per share against a consensus of $0.29, representing a 6.4% surprise. This earnings beat was underpinned by robust revenue growth of 25.6% year-on-year, driven largely by surging demand for AI infrastructure and security services. The company’s ability to monetise its platform across hyperscalers and enterprise clients has reinforced its position as a critical enabler of the generative AI revolution.
From a technical perspective, CRWD currently trades at $189.18, sitting below the 50-day moving average at $194.11, which signals a short-term headwind despite the strong fundamentals. However, the stock remains well above the 200-day moving average at $139.62, indicating that the broader institutional trend remains bullish. With a CANSLIM score of 5 out of 7, the stock demonstrates strong momentum and volume but requires a decisive break above the 50-day MA to confirm a sustained uptrend.
Looking ahead, institutional investors should monitor forward catalysts such as continued expansion in AI data centre partnerships and potential regulatory developments affecting cloud security. While operational risks persist regarding macroeconomic headwinds impacting IT budgets, Cloudflare’s diversified revenue streams and high-margin software model provide a resilient foundation. The market’s reaction to the current technical correction will likely be dictated by whether volume supports a reclaim of the 50-day average in the coming weeks.
Earnings & Quantitative Scorecard
| Key Metric | Reported / Current | Benchmark / Consensus | Status |
|---|---|---|---|
| Quarterly EPS (C) | $0.31 (+35% YoY) | $0.29 (Surprise: +6.4%) | Pass |
| Quarterly Revenue | $1.39B (+25.6% YoY) | Top-line Growth | Pass |
| Annual EPS Growth (A) | N/A | ≥25% Annual CAGR | Fail |
| 52-Week High Range (N) | -16.1% off high | Within 15% of High | Lagging |
| Relative Strength (L) | +62.7% vs SPY | Positive Alpha | Pass |
| Institutional Float (I) | 77% | 30% – 90% Float Ownership | Pass |
| Minervini Trend Template | 6 / 7 Criteria | Stage 2 Uptrend Alignment | Stage 2 (Advancing) |
| Composite CANSLIM Rating | 5 / 7 Pillars | Institutional Quality Setup | 🟡 Developing / Watchlist |
Stage, pattern and sentiment labels are generated by rule-based approximations (Weinstein stage analysis, Minervini trend template and heuristic pattern detection), not by precise technical analysis. Data as of August 27, 2026. For informational and educational purposes only — not investment advice. Always verify against primary sources before making any investment decision.
Discover more from CANSLIM Research
Subscribe to get the latest posts sent to your email.