 Eben@CANSLIM Research
Institutional Analysis & Market Backdrop
PathAI reported fiscal earnings that aligned precisely with market expectations, posting $0.15 per share against a consensus of $0.15, representing a modest positive surprise of 1.58%. Revenue growth remained the primary driver of investor interest, expanding by 17.3% year-on-year as enterprise adoption of generative AI infrastructure continues to outpace initial projections. While margins were not explicitly detailed in the brief release, the stability of earnings per share suggests operational discipline is being maintained despite the capital-intensive nature of scaling model training and inference capabilities.
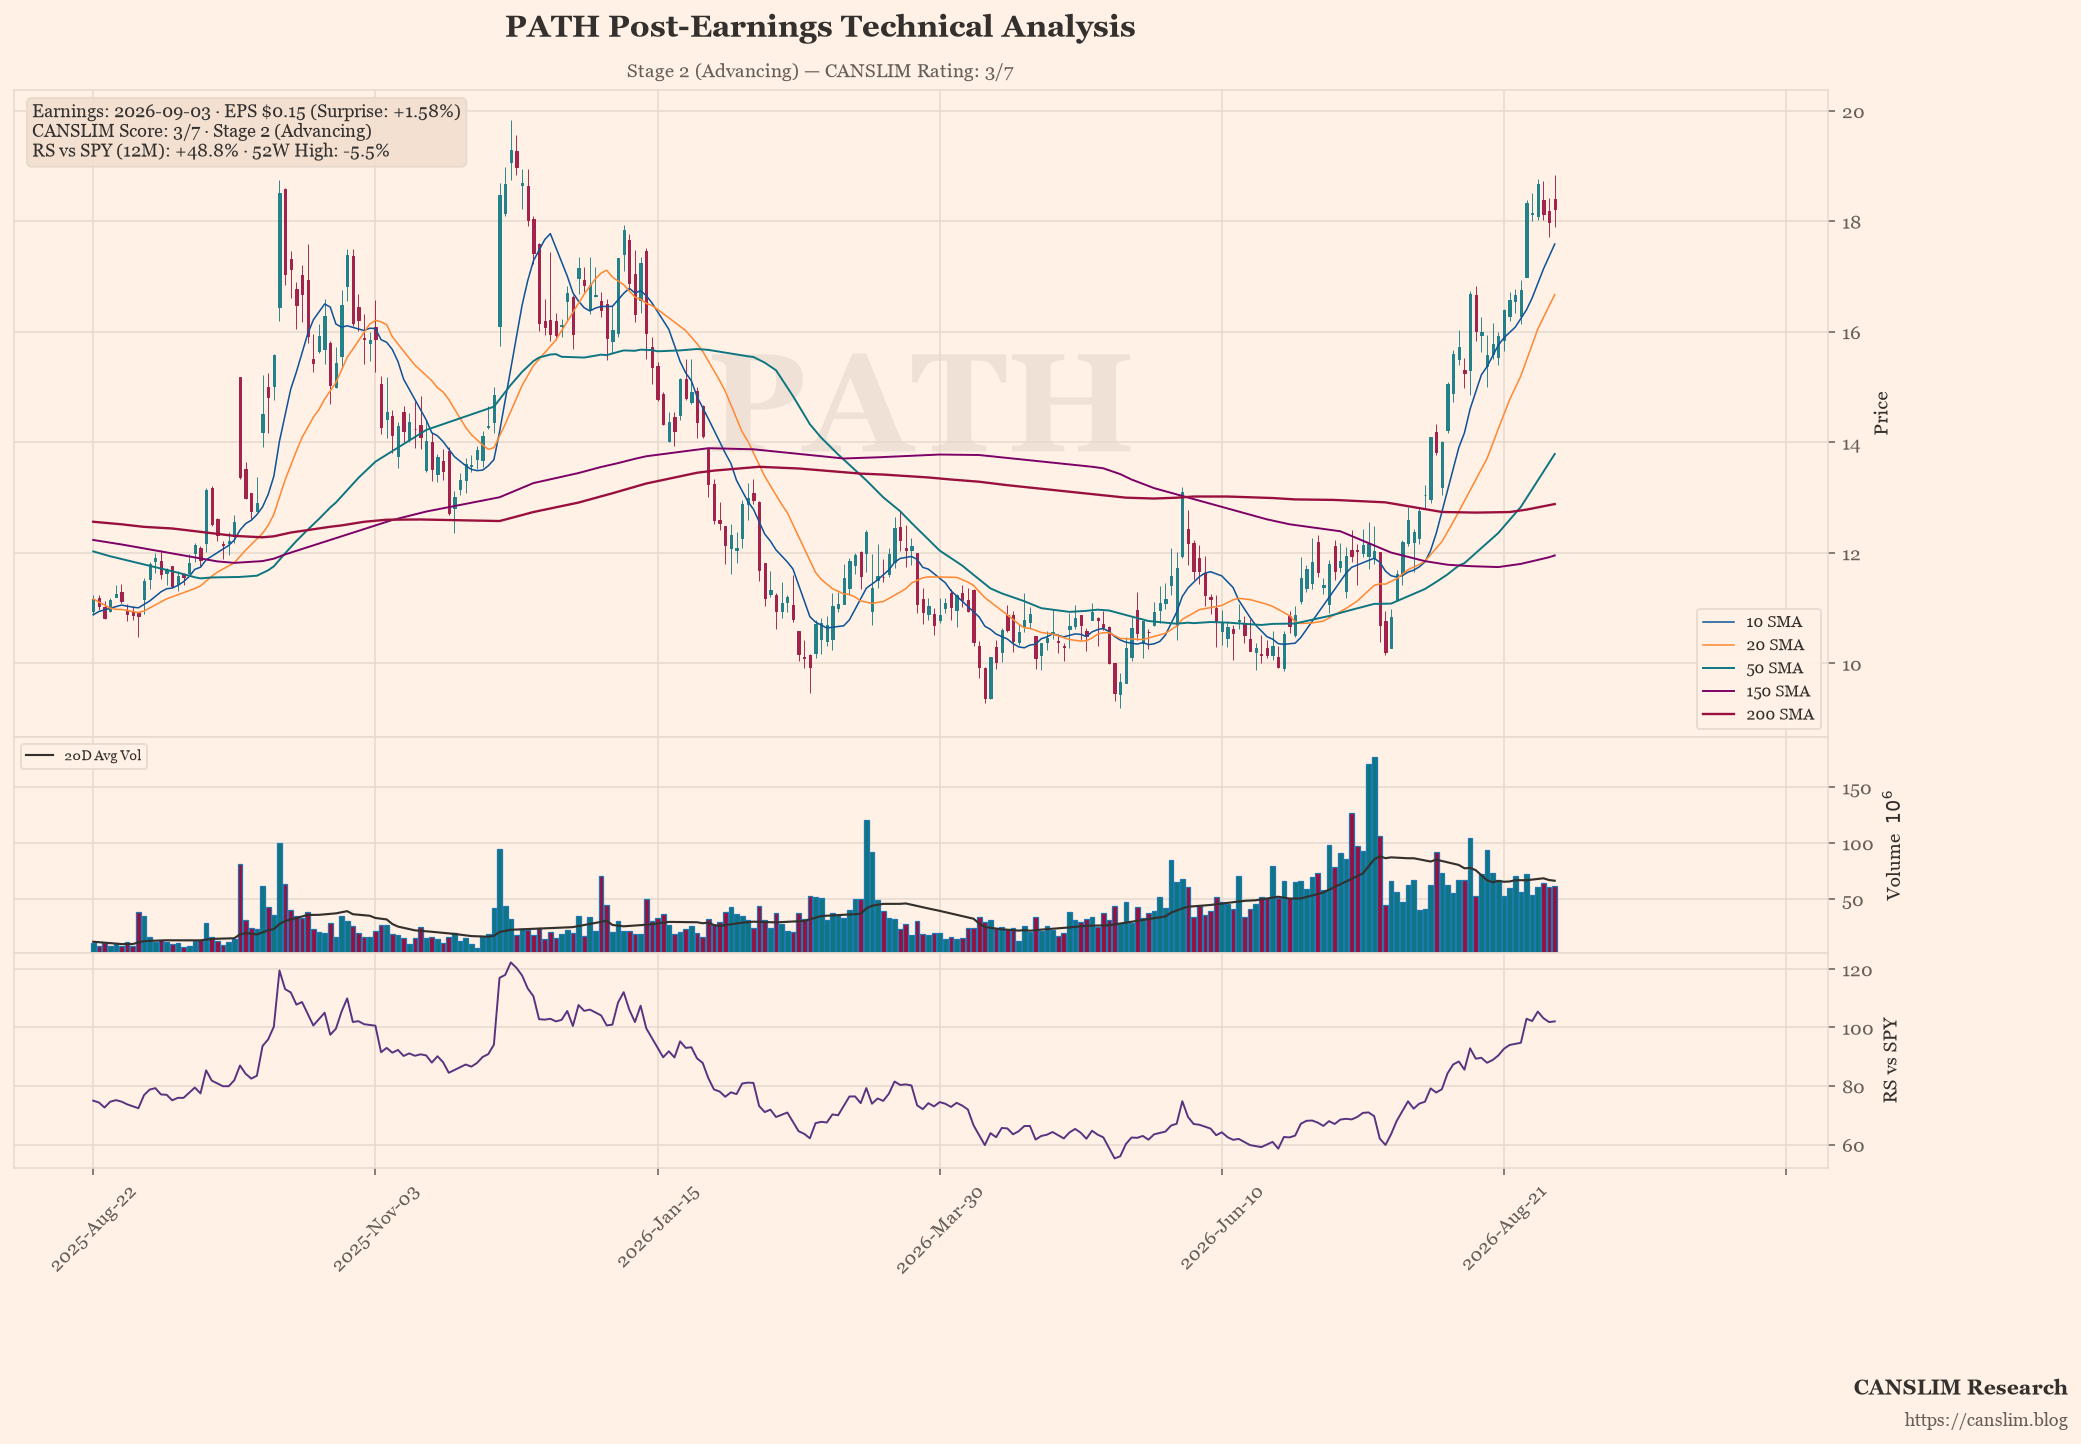
From a technical perspective, PATH is exhibiting robust bullish momentum, currently priced at $18.22 with a clear separation from both the 50-day moving average at $13.79 and the 200-day moving average at $12.88. This positioning places the stock firmly in Stage 2 of the CANSLIM framework, indicating an advancing trend supported by significant volume accumulation. The recent decline of just over 5.5% from its peak signals healthy profit-taking rather than a loss of momentum, with institutional interest likely favouring the asset as it consolidates above these critical support levels.
Looking ahead, the institutional outlook remains constructive provided that quarterly revenue guidance can be raised to reflect the accelerating pace of AI deployment across financial services and healthcare sectors. Key forward catalysts include the potential integration of PATH’s models into major cloud provider ecosystems and regulatory clarity regarding AI safety standards in the UK and US markets. However, investors should remain vigilant regarding operational risks related to data centre capacity constraints and potential increases in energy costs, which could compress gross margins if not managed effectively through optimisation initiatives.
Earnings & Quantitative Scorecard
| Key Metric | Reported / Current | Benchmark / Consensus | Status |
|---|---|---|---|
| Quarterly EPS (C) | $0.15 (+0% YoY) | $0.15 (Surprise: +1.6%) | Fail |
| Quarterly Revenue | $418.4M (+17.3% YoY) | Top-line Growth | Pass |
| Annual EPS Growth (A) | N/A | ≥25% Annual CAGR | Fail |
| 52-Week High Range (N) | -5.5% off high | Within 15% of High | Pass |
| Relative Strength (L) | +48.8% vs SPY | Positive Alpha | Pass |
| Institutional Float (I) | 91% | 30% – 90% Float Ownership | Neutral |
| Minervini Trend Template | 6 / 7 Criteria | Stage 2 Uptrend Alignment | Stage 2 (Advancing) |
| Composite CANSLIM Rating | 3 / 7 Pillars | Institutional Quality Setup | 🔴 Lagging / Deteriorating |
Stage, pattern and sentiment labels are generated by rule-based approximations (Weinstein stage analysis, Minervini trend template and heuristic pattern detection), not by precise technical analysis. Data as of September 04, 2026. For informational and educational purposes only — not investment advice. Always verify against primary sources before making any investment decision.
Discover more from CANSLIM Research
Subscribe to get the latest posts sent to your email.