 Eben@CANSLIM Research
Institutional Analysis & Market Backdrop
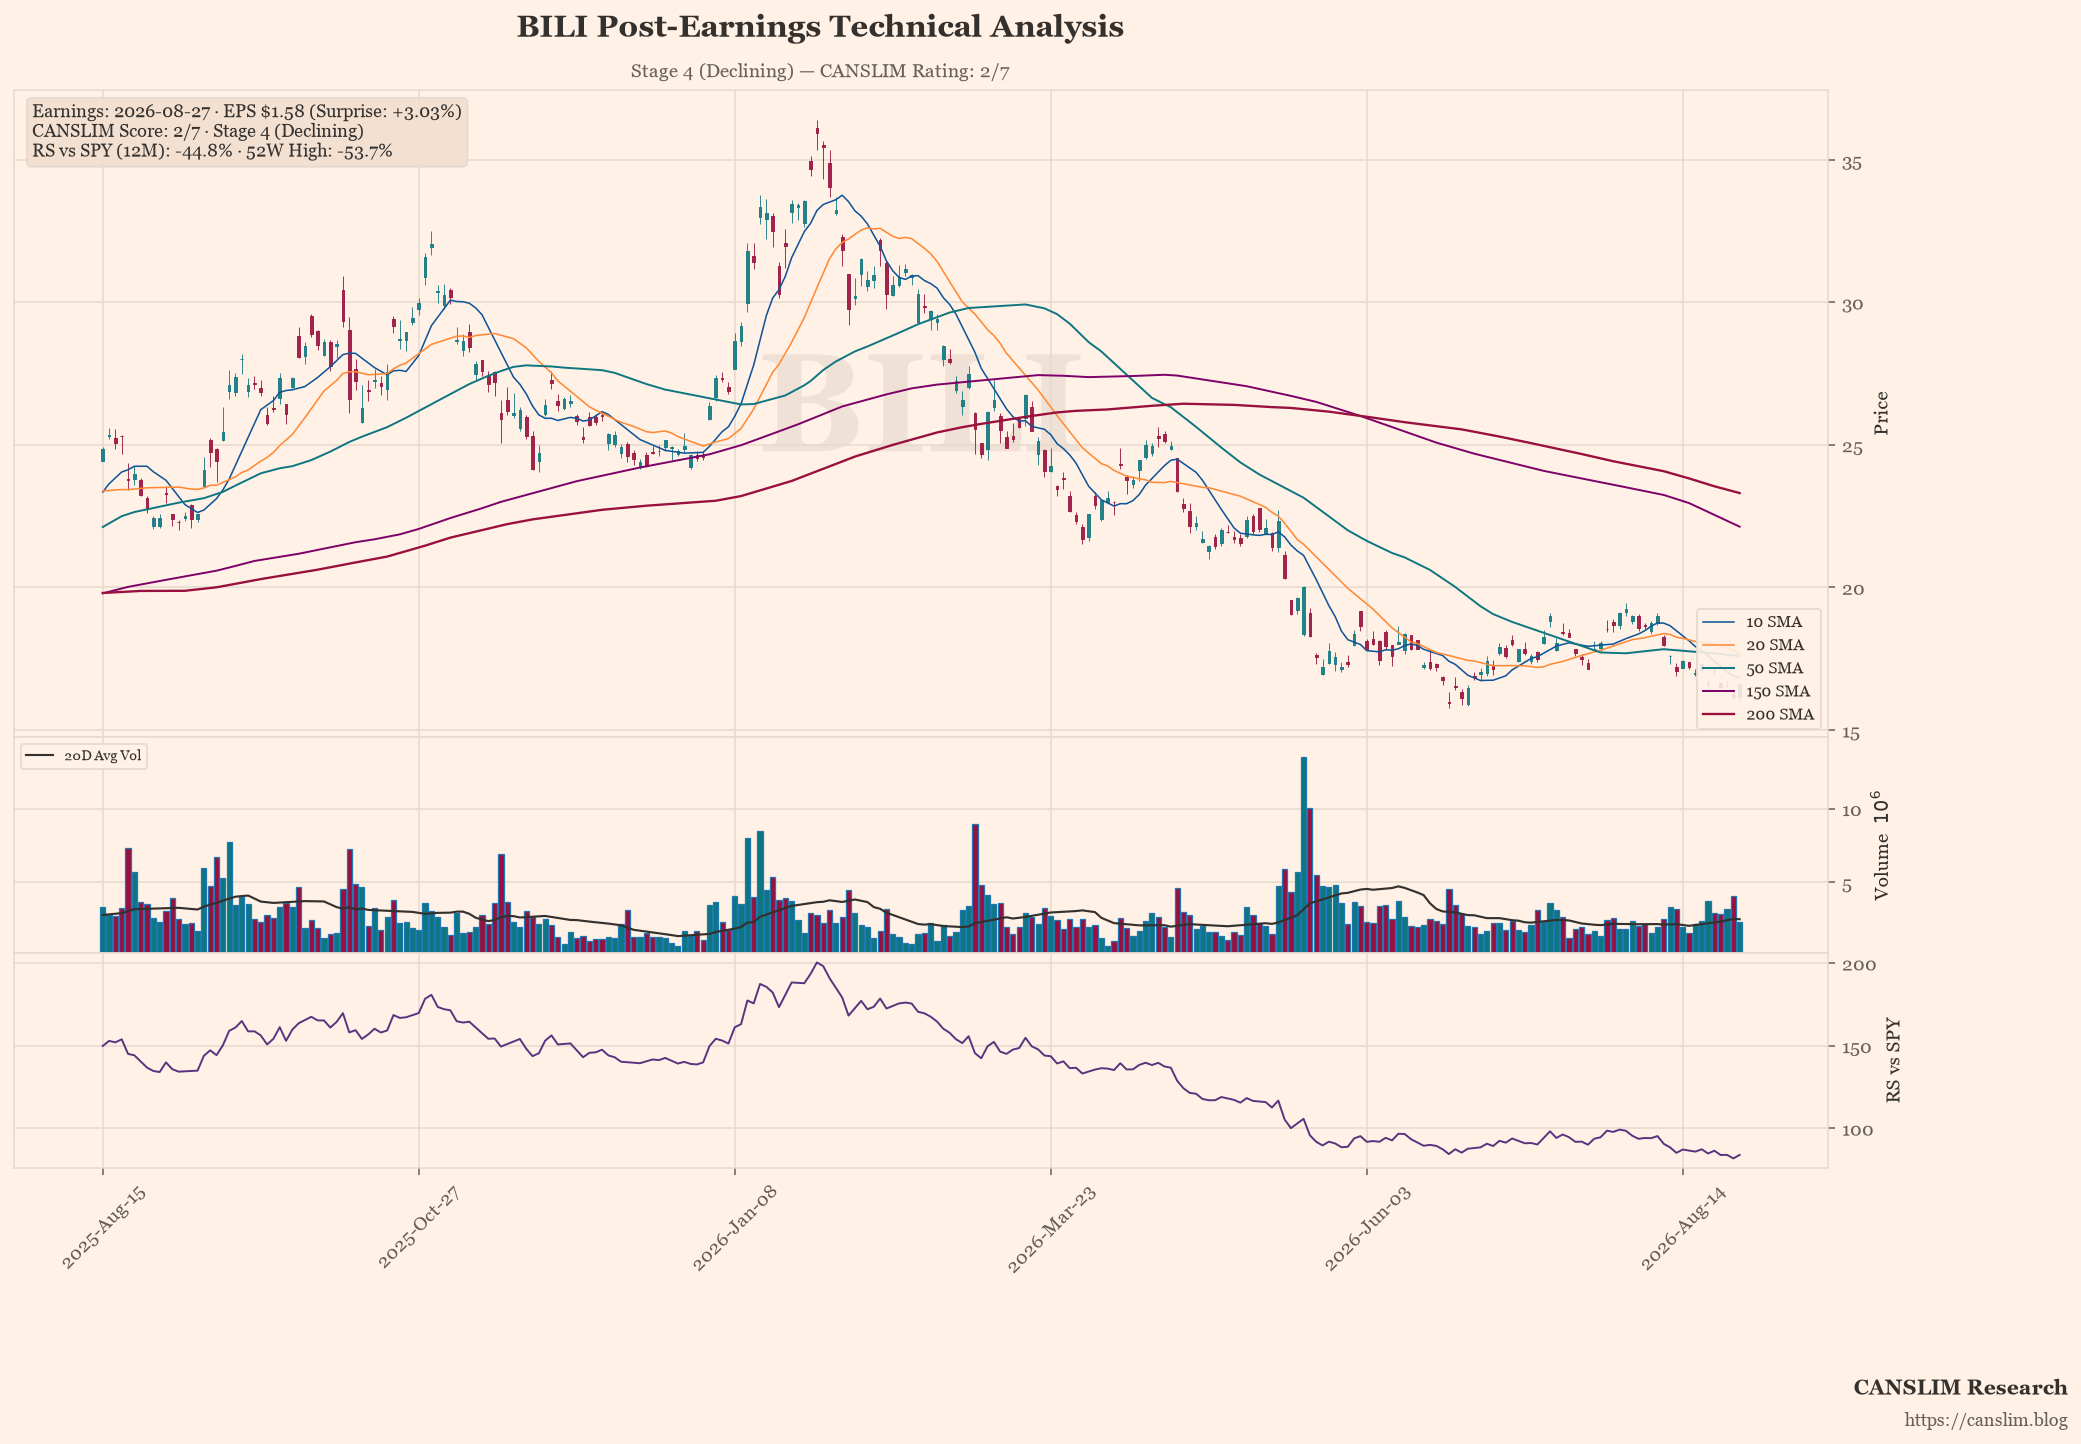
BILI announced earnings of $1.58 per share, edging above the analyst consensus of $1.53 and delivering a positive surprise of approximately three per cent. Revenue growth remained modest at 6.7% year-on-year, reflecting continued headwinds in the domestic market despite operational efficiencies. While the bottom-line result suggests some stabilisation in cost management, the lack of significant top-line acceleration indicates that organic demand is struggling to recover from recent regulatory and competitive pressures.
Technically, the stock remains in a bearish configuration, trading at $16.63 with a decline of over 53% from its recent peak. The share price is currently under pressure, failing to breach the critical support level provided by the 50-day moving average at approximately $17.60. With the 200-day moving average sitting significantly higher at $23.31, the asset lacks the momentum required for a CANSLIM buy signal and remains in Stage 4 of its technical cycle, suggesting that further downside volatility is probable until a clear reversal pattern emerges.
Institutional outlook remains cautious as forward catalysts are weighed against persistent operational risks. Management must demonstrate accelerated revenue growth to justify the current valuation multiple, particularly given the prolonged period of underperformance relative to sector peers. Until BILI can signal a transition out of its declining technical stage and regain institutional favour through sustained earnings expansion, investors should maintain a defensive posture and await confirmation of a structural bottom before considering re-entry.
Earnings & Quantitative Scorecard
| Key Metric | Reported / Current | Benchmark / Consensus | Status |
|---|---|---|---|
| Quarterly EPS (C) | $1.58 (+22% YoY) | $1.53 (Surprise: +3.0%) | Pass |
| Quarterly Revenue | $7.47B (+6.7% YoY) | Top-line Growth | Pass |
| Annual EPS Growth (A) | N/A | ≥25% Annual CAGR | Fail |
| 52-Week High Range (N) | -53.7% off high | Within 15% of High | Lagging |
| Relative Strength (L) | -44.8% vs SPY | Positive Alpha | Fail |
| Institutional Float (I) | 8% | 30% – 90% Float Ownership | Neutral |
| Minervini Trend Template | 0 / 7 Criteria | Stage 2 Uptrend Alignment | Stage 4 (Declining) |
| Composite CANSLIM Rating | 2 / 7 Pillars | Institutional Quality Setup | 🔴 Lagging / Deteriorating |
Stage, pattern and sentiment labels are generated by rule-based approximations (Weinstein stage analysis, Minervini trend template and heuristic pattern detection), not by precise technical analysis. Data as of August 27, 2026. For informational and educational purposes only — not investment advice. Always verify against primary sources before making any investment decision.
Discover more from CANSLIM Research
Subscribe to get the latest posts sent to your email.