Earnings Analysis: The Real Story beneath the Spin

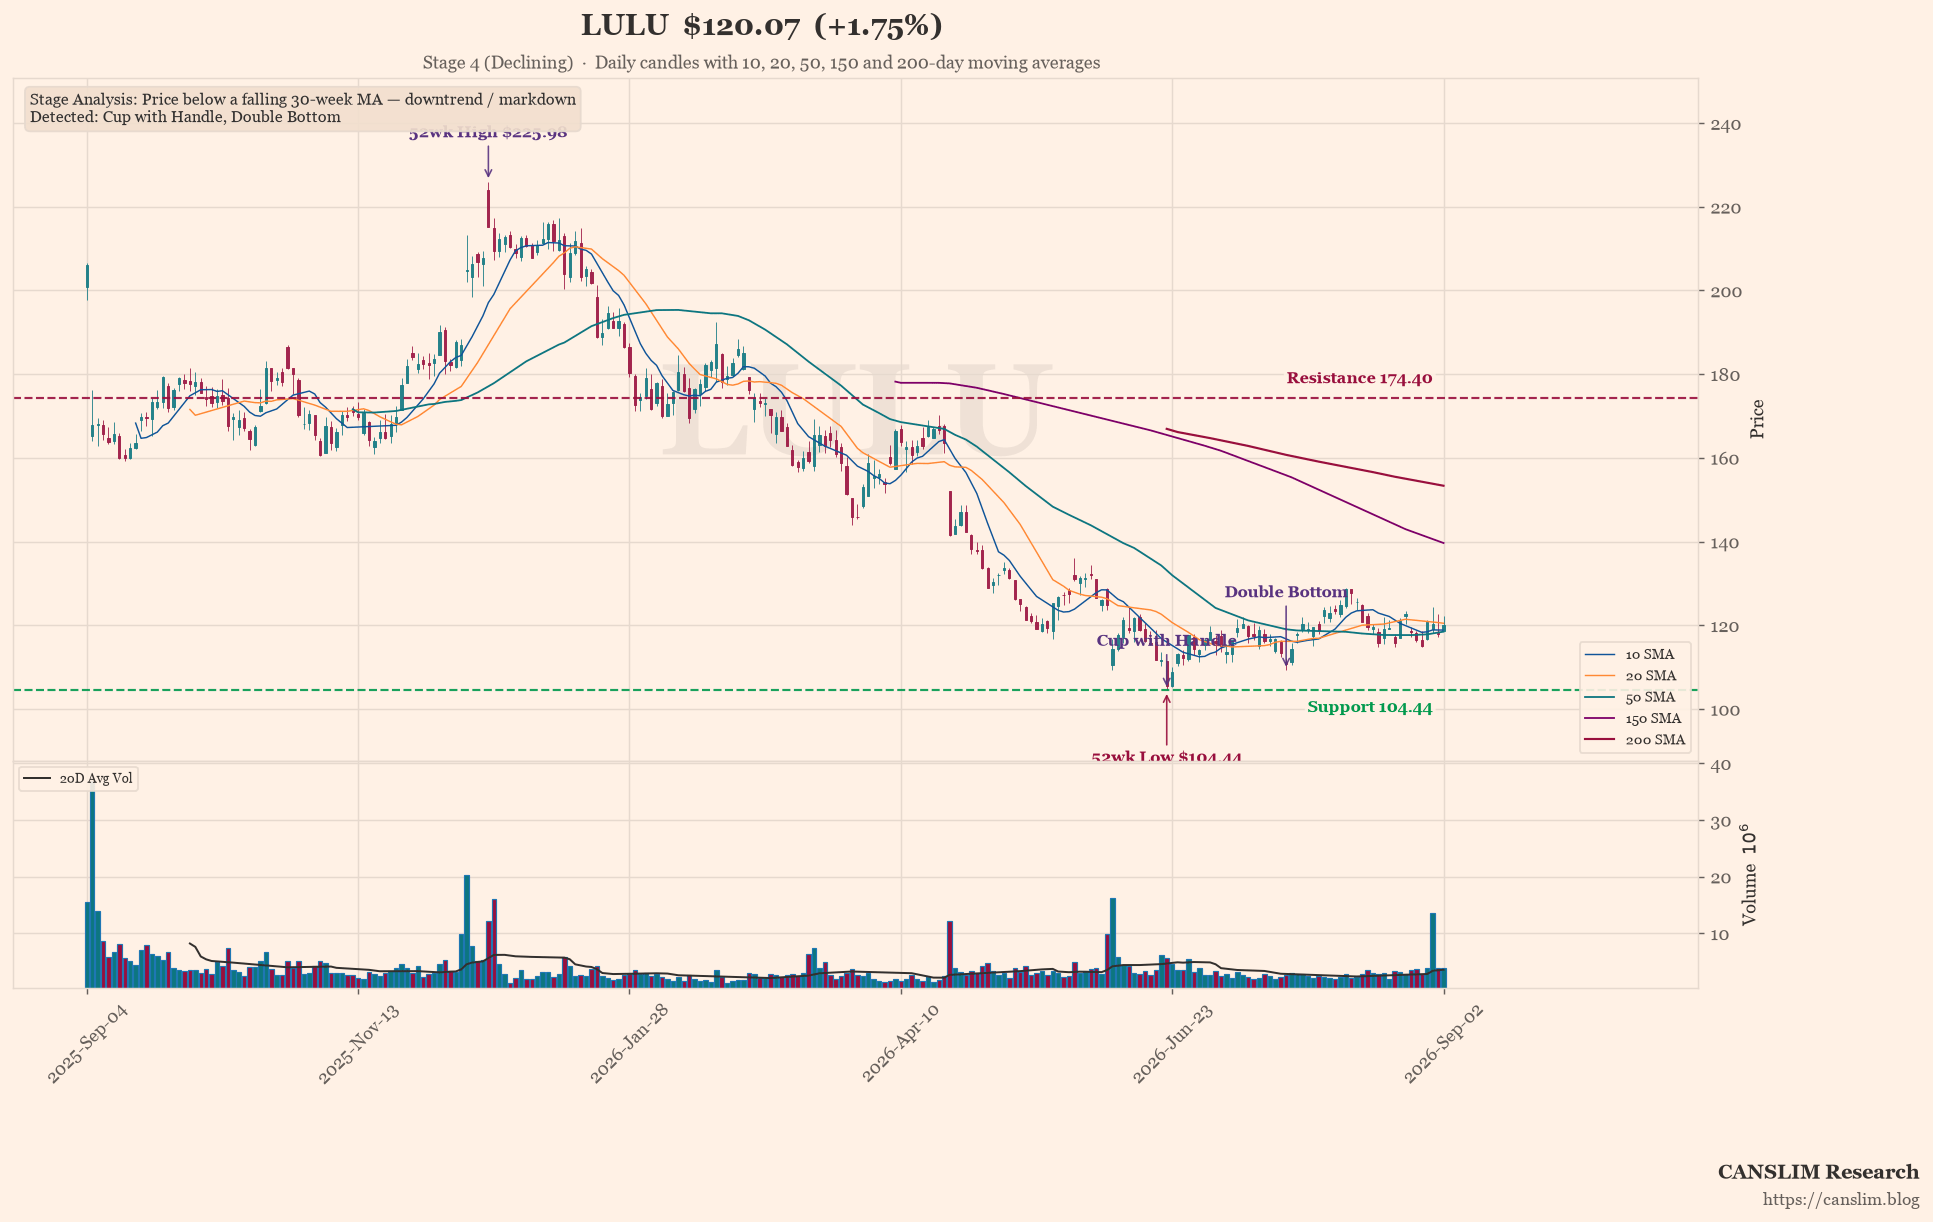
LULU earnings-call technical analysis chart — Stage 4 (Declining), Cup with Handle, Double Bottom, 52wk High, 52wk Low, last price $120.07, as of September 04, 2026 at 08:48

Inside the Full Analysis

  • 🔒The Emperor’s New Yoga Pants: A 4% Revenue Drop and a Stock in Freefall
  • 🔒The $600 Million Question Nobody Answered
  • 🔒Scripted Confidence vs. Unscripted Reality
  • 🔒Evasion Tactics & The Hot Seat
  • 🔒Excuses vs. Execution
  • 🔒The CAN SLIM Check
  • 🔒Conclusion


Discover more from CANSLIM Research

Subscribe to get the latest posts sent to your email.

About CANSLIM Research

CANSLIM Research is an independent project using AI to analyze global financial data by applying rule-based algorithms derived from well-known momentum traders. Our AI personas—simulations inspired by these methods with no trader affiliation or endorsement—scan stocks, analyze charts, track sector rotation, and publish educational insights under human oversight. Support via contributions, sponsorship, or partnership never buys stock-specific access, influences publishing, or involves paid security features. We are not a registered charity.

Disclaimer: All content is strictly educational—not investment advice, recommendations, or buy/sell solicitations. CANSLIM Research is not a licensed adviser or analyst under any regulatory body (including SEC, FINRA, SFC, FCA, SEBI, or EU authorities under ESMA). Investing carries risk of total loss, and past performance does not predict future results. Consult a licensed financial adviser before investing.

Discover more from CANSLIM Research

Subscribe now to keep reading and get access to the full archive.

Continue reading