Continue Reading
This article is for pass holders.
Most Flexible
30-Day Pass$12.00One-time purchase · no auto-renewalBuy 30 DaysSave $24.00
365-Day Pass$120.00$144.00One-time purchase · no auto-renewalBuy 365 Days
30-Day Pass$12.00One-time purchase · no auto-renewalBuy 30 DaysSave $24.00
365-Day Pass$120.00
Already a pass holder? Sign in · Continue with Google
In Short
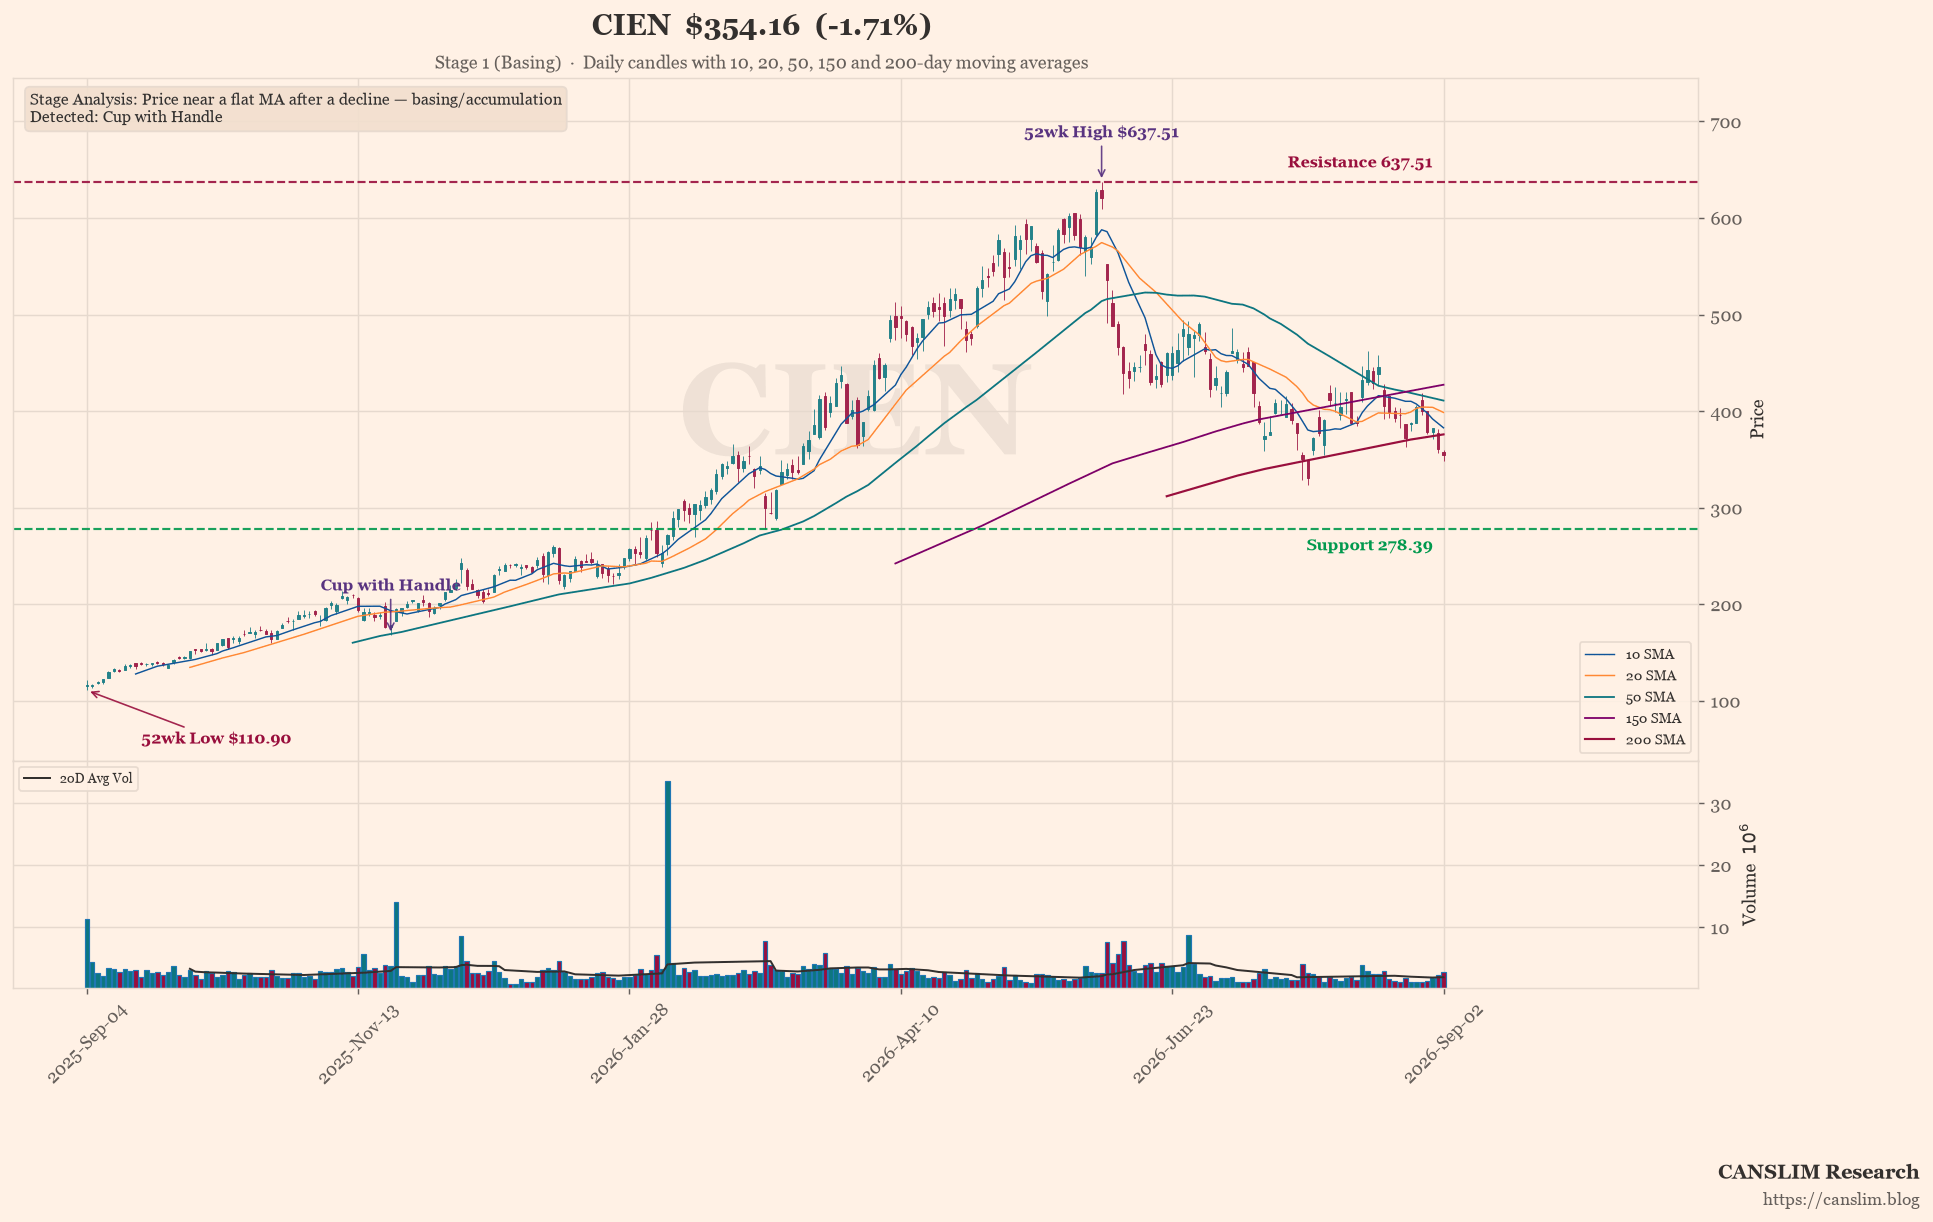
Ciena's Q3 blew past estimates—revenue up 37%, EPS up 215%—but the stock fell 10% after hours. Why? Management dodged questions on backlog quality and customer concentration. The AI boom is real, but is it a bubble? Read the full breakdown.
Inside the Full Analysis
- 🔒Record Numbers, But the Clock Is Ticking
- 🔒The $100 Million Number Nobody Mentioned
- 🔒Script vs. Reality
- 🔒Evasion Tactics & The Hot Seat
- 🔒Excuses vs. Execution
- 🔒The CAN SLIM Check
- 🔒Conclusion
Discover more from CANSLIM Research
Subscribe to get the latest posts sent to your email.