Continue Reading
This article is for pass holders.
Most Flexible
30-Day Pass$12.00One-time purchase · no auto-renewalBuy 30 DaysSave $24.00
365-Day Pass$120.00$144.00One-time purchase · no auto-renewalBuy 365 Days
30-Day Pass$12.00One-time purchase · no auto-renewalBuy 30 DaysSave $24.00
365-Day Pass$120.00
Already a pass holder? Sign in · Continue with Google
In Short
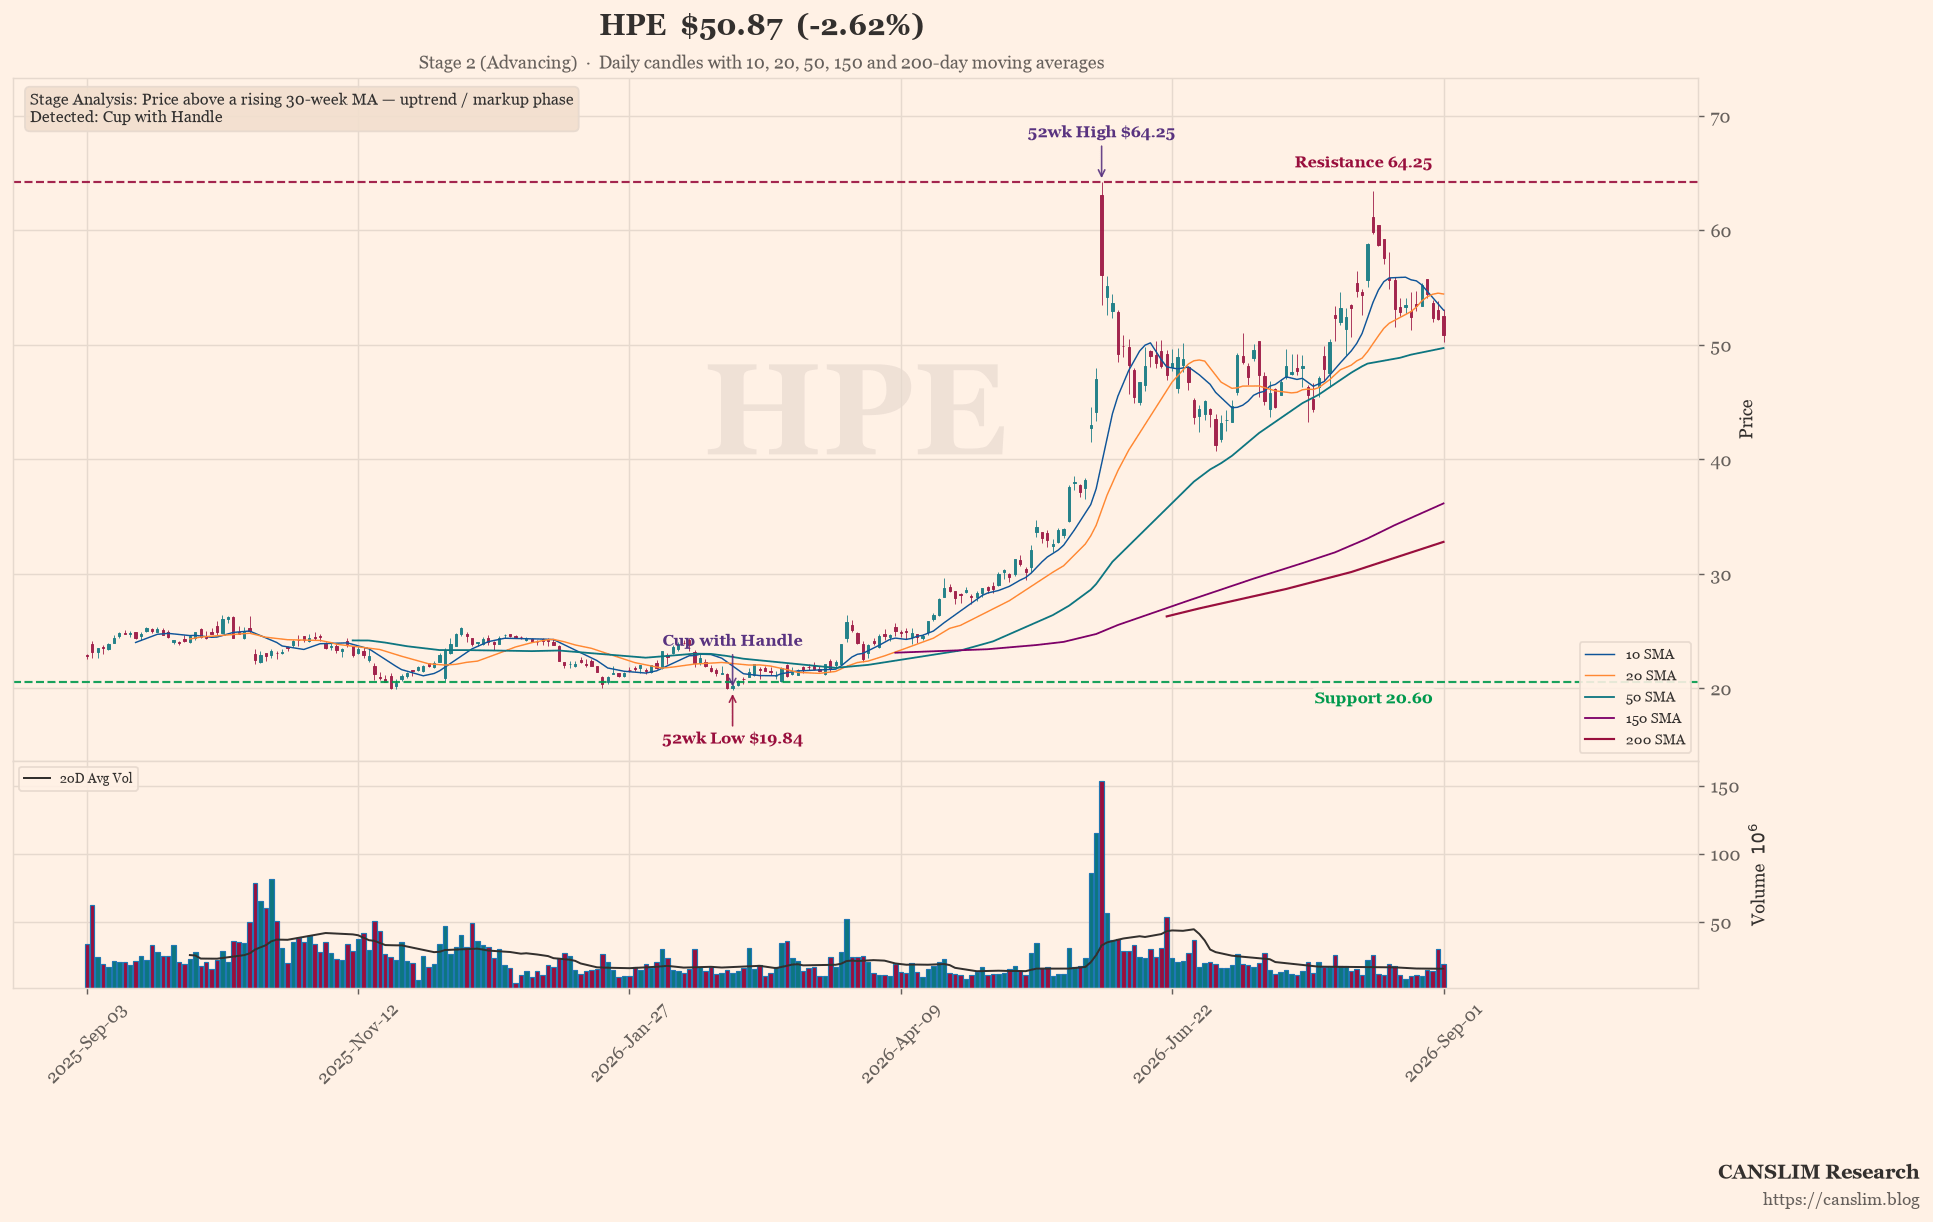
HPE's Q3 looked record-breaking, but the stock fell after hours. AI server demand is booming, yet networking growth is stalling and supply constraints are unquantified. Management dodged key analyst questions. Is the AI boom masking deeper problems? Read the full breakdown.
Inside the Full Analysis
- 🔒Record Results, But the Cracks Are Starting to Show
- 🔒The $1.2 Billion Question Nobody Asked
- 🔒Scripted Optimism Meets Unscripted Evasion
- 🔒Three Questions That Exposed the Weak Spots
- 🔒Excuses or Execution Failures?
- 🔒The CAN SLIM Check
- 🔒Conclusion
Discover more from CANSLIM Research
Subscribe to get the latest posts sent to your email.