In Short
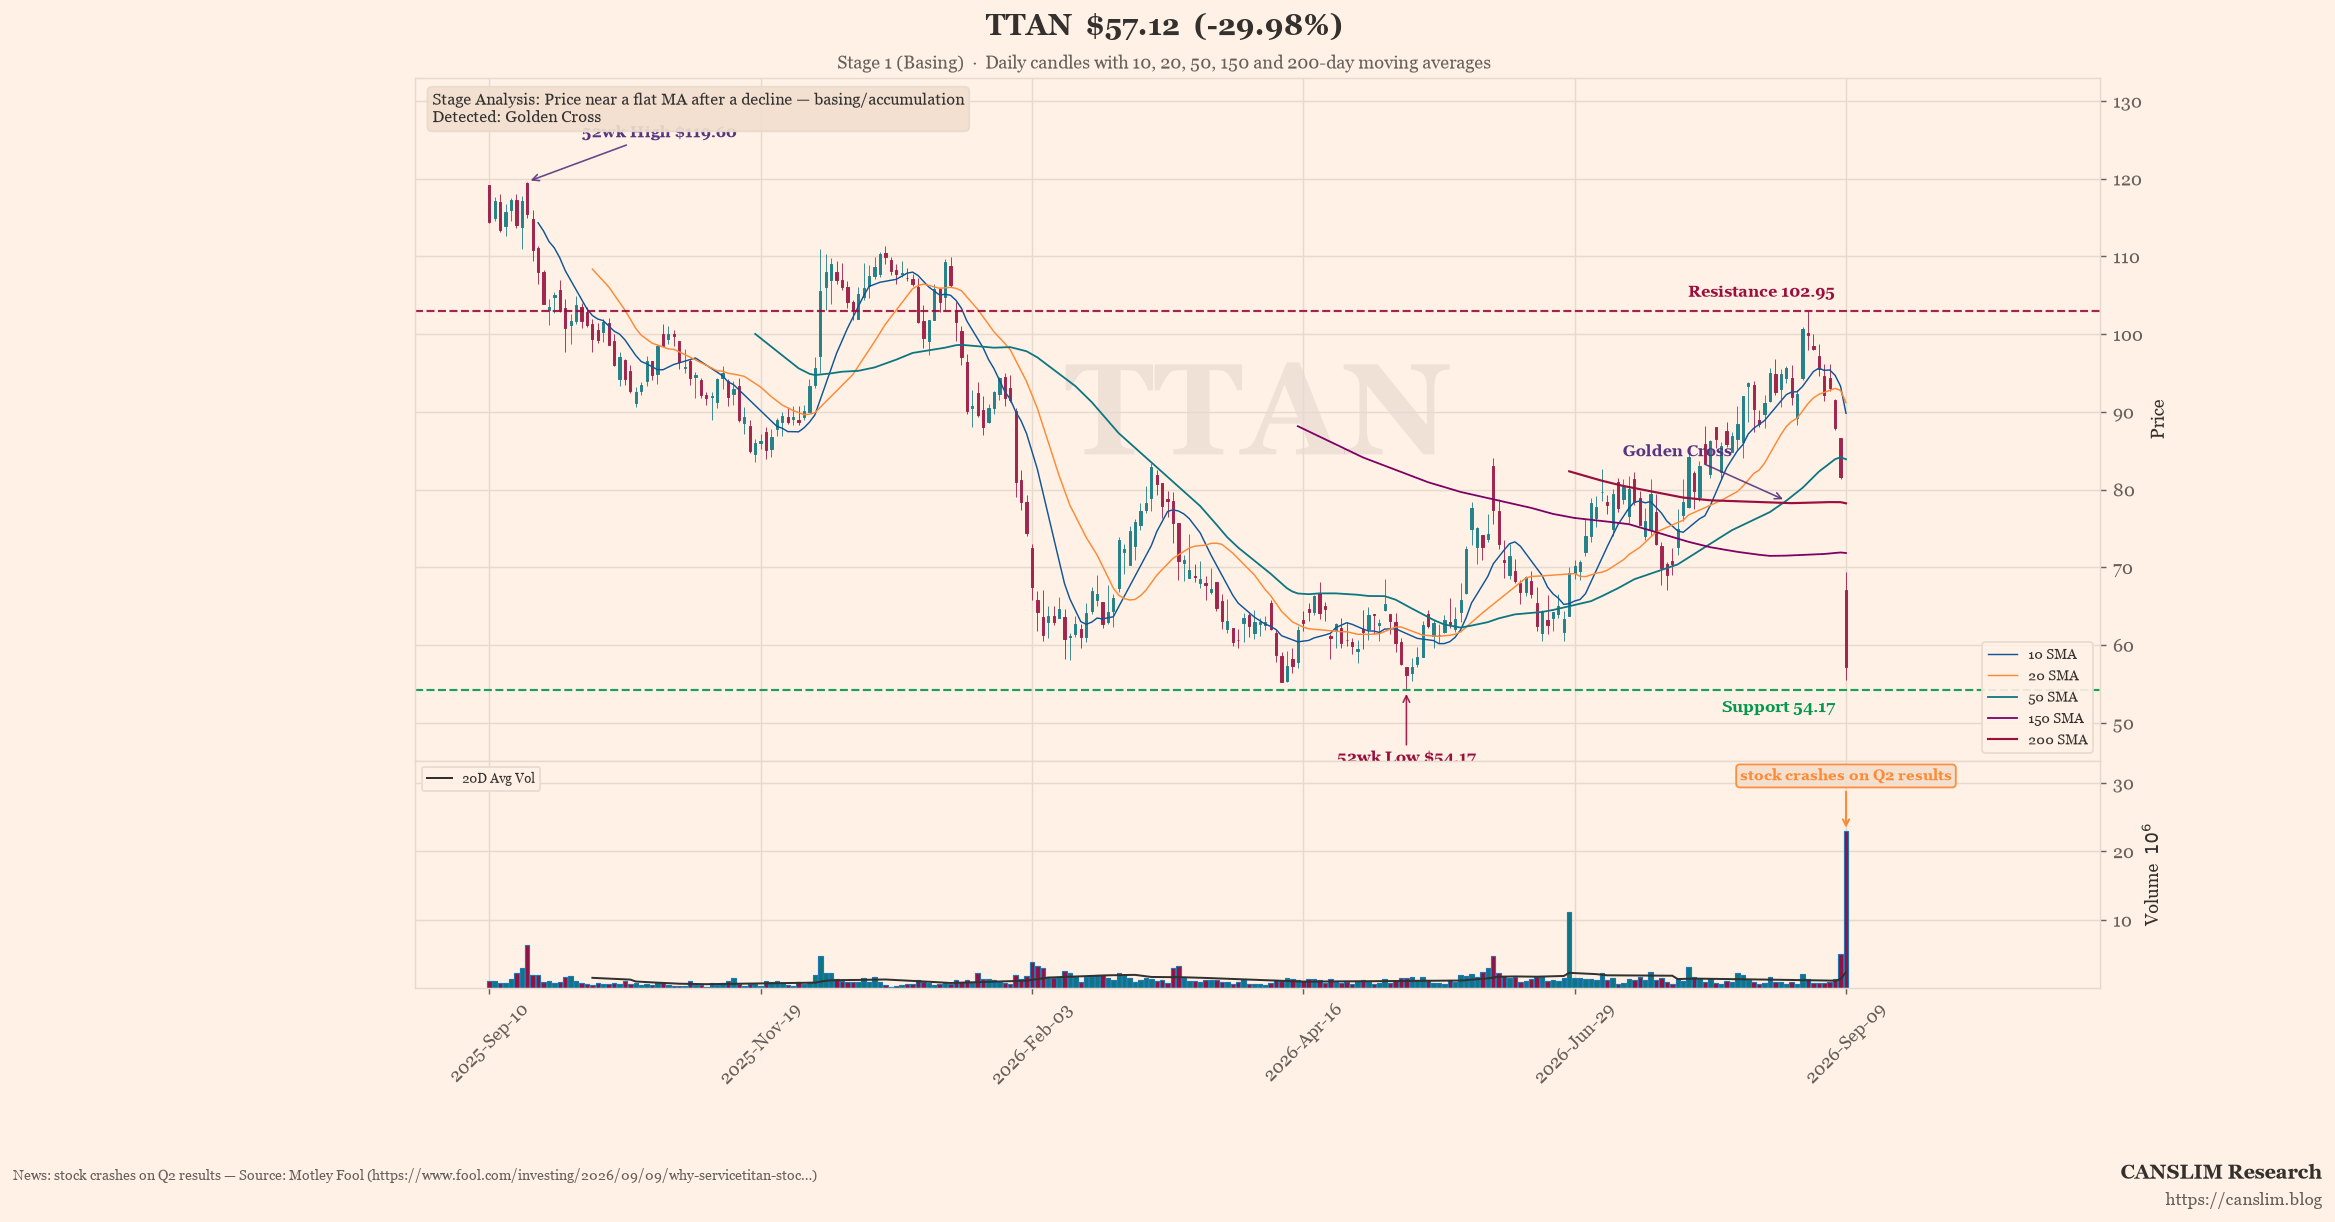
ServiceTitan beat on earnings but guided growth down to 21% from 25%, and the stock crashed 30% after hours. Management is spending big on AI while core metrics like GTV and retention vanished from the call. The real story? A risky bet that may not pay off. Read the full analysis.
Inside the Full Analysis
- 🔒Growth Deceleration Meets Spending Surprise
- 🔒The Vanishing Metrics: What Management Stopped Talking About
- 🔒Script vs. Reality: The Confidence Crack
- 🔒Evasion Tactics & The Hot Seat
- 🔒Excuses vs. Execution: No Macro Boogeyman Here
- 🔒The CAN SLIM Check
- 🔒Conclusion
Continue Reading
This article is for pass holders.
Most Flexible
30-Day Pass$12.00One-time purchase · no auto-renewalBuy 30 DaysSave $24.00
365-Day Pass$120.00$144.00One-time purchase · no auto-renewalBuy 365 Days
30-Day Pass$12.00One-time purchase · no auto-renewalBuy 30 DaysSave $24.00
365-Day Pass$120.00
Already a pass holder? Sign in · Continue with Google