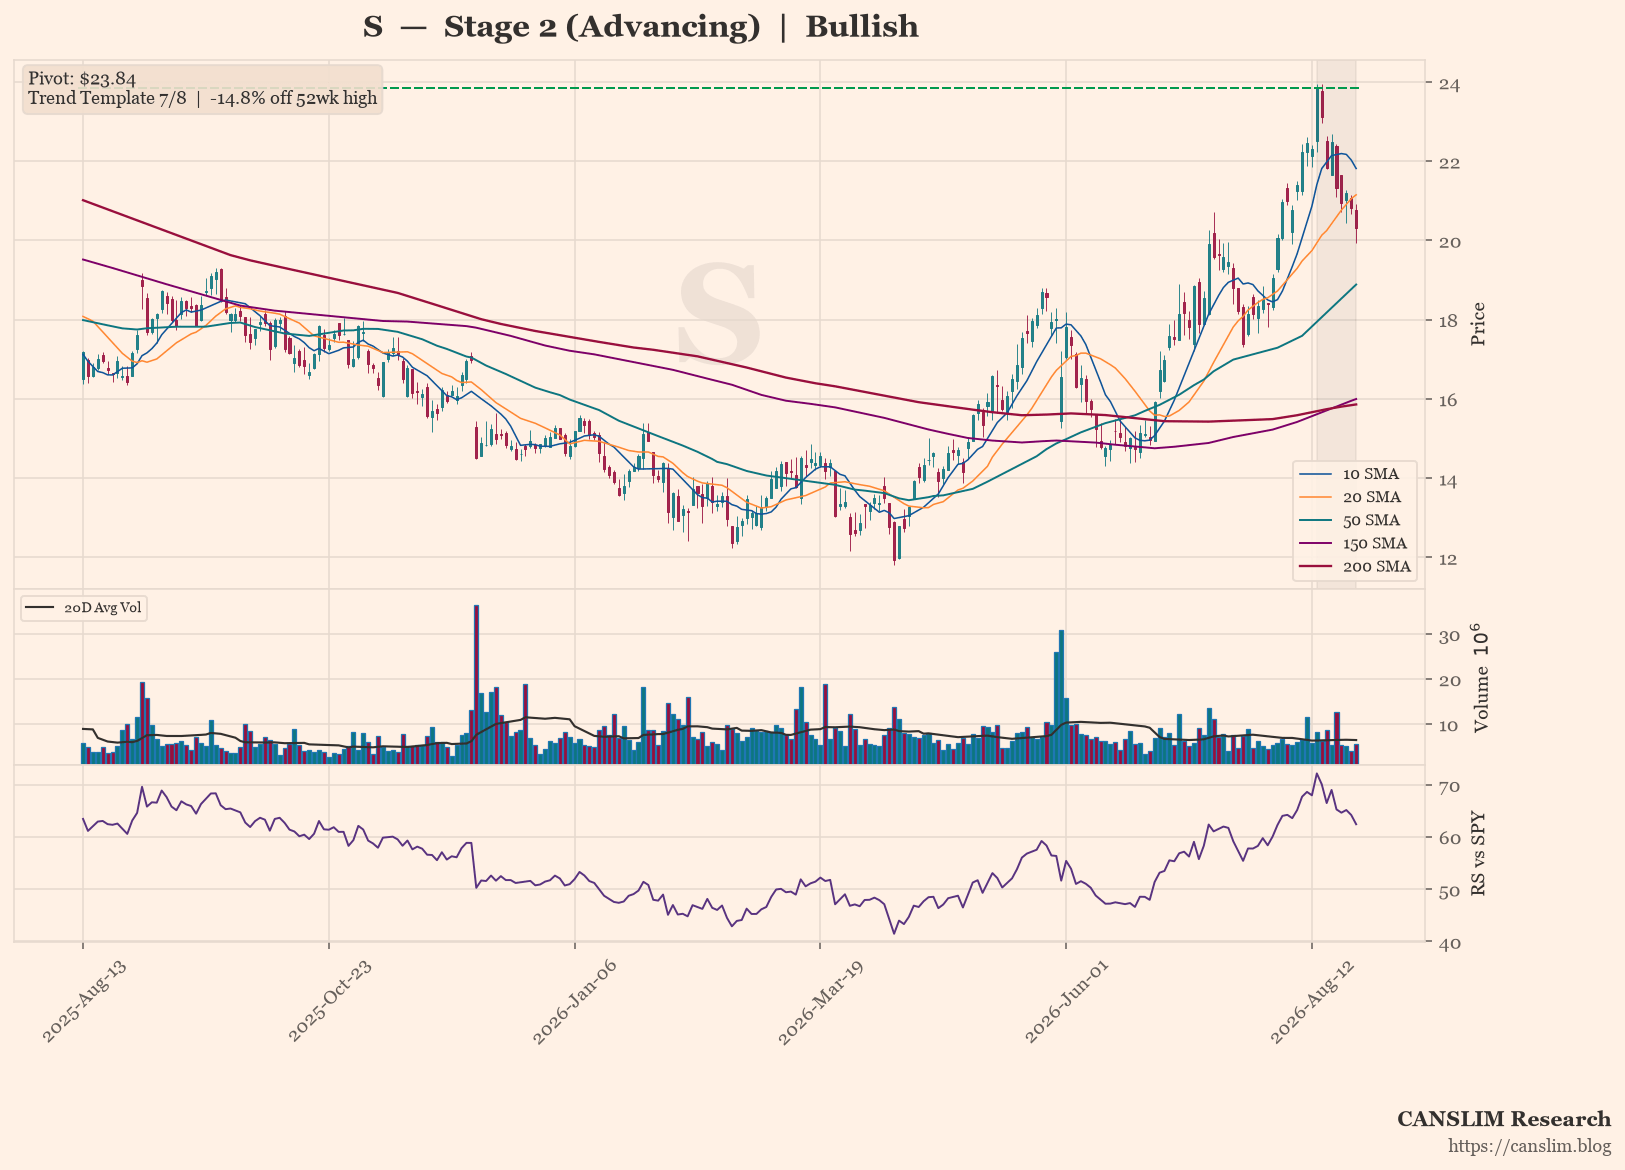
S is in a confirmed Stage 2 uptrend, with price holding above a rising 30-week moving average and 7 of 8 trend-template checks passing. The stock is 70% above its 52-week low and within 15% of its high, though it has pulled back 14.8% over the past two weeks into a shallow, short base. Market focus is on the lack of a proper base or VCP, but the overall sentiment remains bullish with an offensive setup in place.
As of 2026-08-25 · Close $20.31
Stage 2 (Advancing) — Price holding above a rising 30-week MA — uptrend intact (30-week MA 6-week slope: 7.32%)
Continue Reading
This article is for pass holders.
Most Flexible
30-Day Pass$12.00One-time purchase · no auto-renewalBuy 30 DaysSave $24.00
365-Day Pass$120.00$144.00One-time purchase · no auto-renewalBuy 365 Days
30-Day Pass$12.00One-time purchase · no auto-renewalBuy 30 DaysSave $24.00
365-Day Pass$120.00
Already a pass holder? Sign in · Continue with Google