 Eben@CANSLIM Research
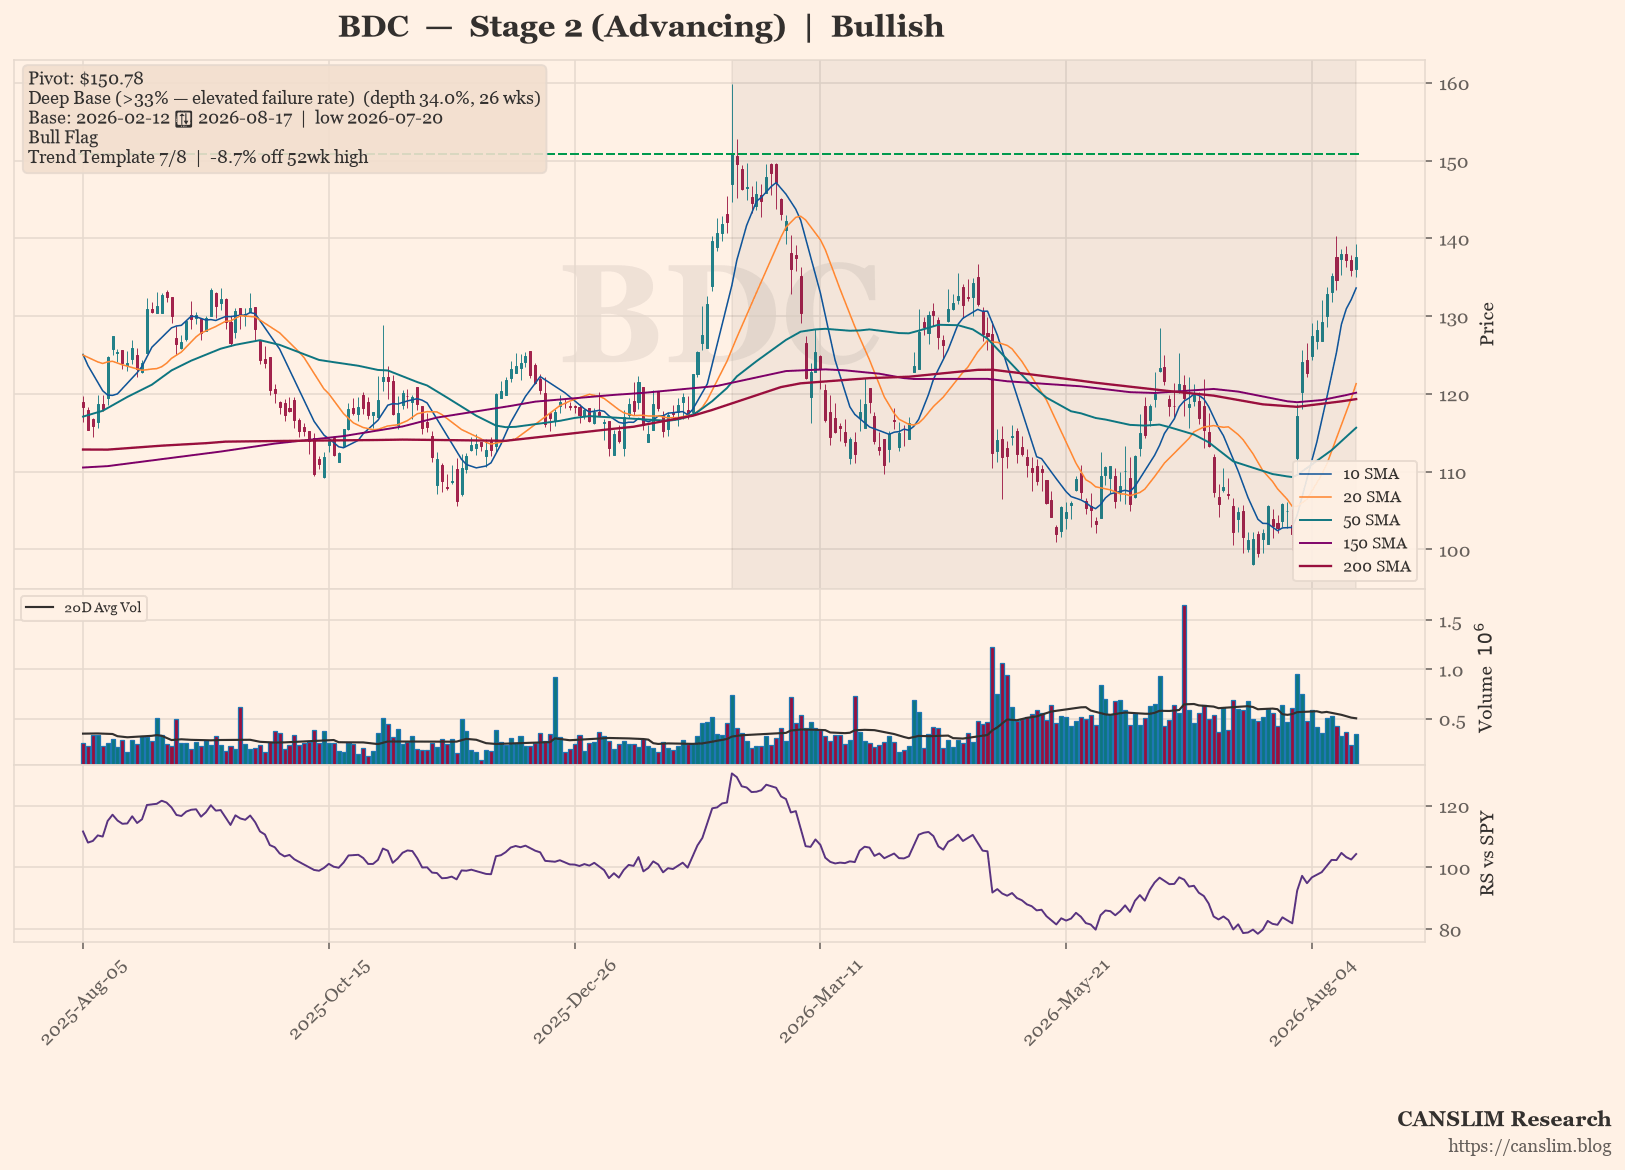
BDC is trading at 137.59, holding above a rising 30-week moving average within a confirmed Stage 2 advance. The market is focused on a newly detected bull flag pattern following a 38.7% run, though the stock remains 8.7% below its 52-week high and is emerging from a deep 34% base with an elevated failure rate.
Overall sentiment is bullish, with 7 of 8 trend template checks passing and the Relative Strength line near a 3-month high. However, the absence of a VCP contraction sequence and the depth of the prior base warrant caution as price approaches the 150.78 pivot.
Technical Analysis
As of 2026-08-17 · Close $137.59
Stage Analysis
Stage 2 (Advancing) — Price holding above a rising 30-week MA — uptrend intact (30-week MA 6-week slope: 1.46%)
Detected Patterns — What the Market Is Watching
- Deep Base (>33% — elevated failure rate) — depth 34.0%, length 26 weeks, pivot $150.78. Base formed from 2026-02-12 (left-side high) to 2026-08-17, with the low of $99.52 set on 2026-07-20
- Bull Flag after a 38.7% run, currently 0.3% off the flag high

Subscribe to continue reading
Become a paid subscriber to get access to the rest of this post and other exclusive content.