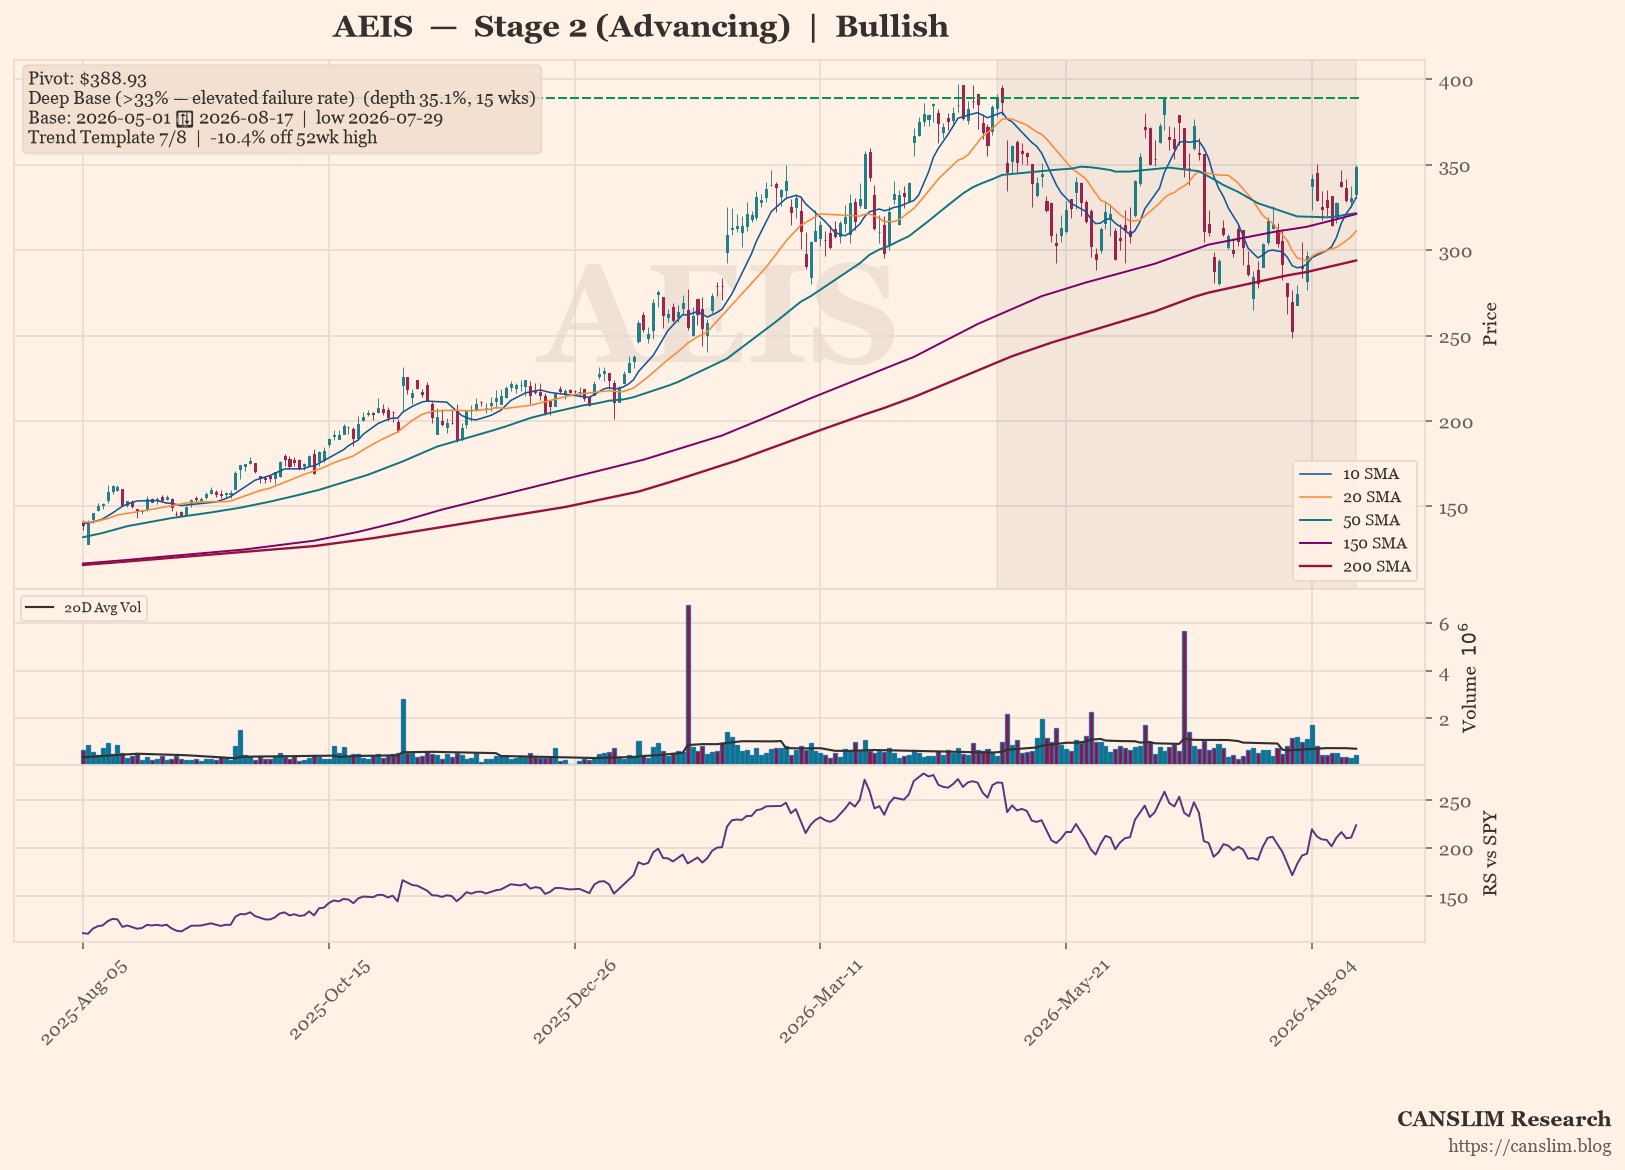
AEIS is holding a Stage 2 advancing trend, trading above a rising 30-week moving average with seven of eight trend-template checks passing. The market is focused on a 15-week deep base with a 35.1% correction, a pattern historically linked to elevated failure rates. Overall sentiment is bullish, though the lack of a confirmed breakout and the base’s depth warrant caution.
As of 2026-08-17 · Close $348.63
Stage 2 (Advancing) — Price holding above a rising 30-week MA — uptrend intact (30-week MA 6-week slope: 4.52%)
Continue Reading
This article is for pass holders.
Most Flexible
30-Day Pass$12.00One-time purchase · no auto-renewalBuy 30 DaysSave $24.00
365-Day Pass$120.00$144.00One-time purchase · no auto-renewalBuy 365 Days
30-Day Pass$12.00One-time purchase · no auto-renewalBuy 30 DaysSave $24.00
365-Day Pass$120.00
Already a pass holder? Sign in · Continue with Google