 Eben@CANSLIM Research
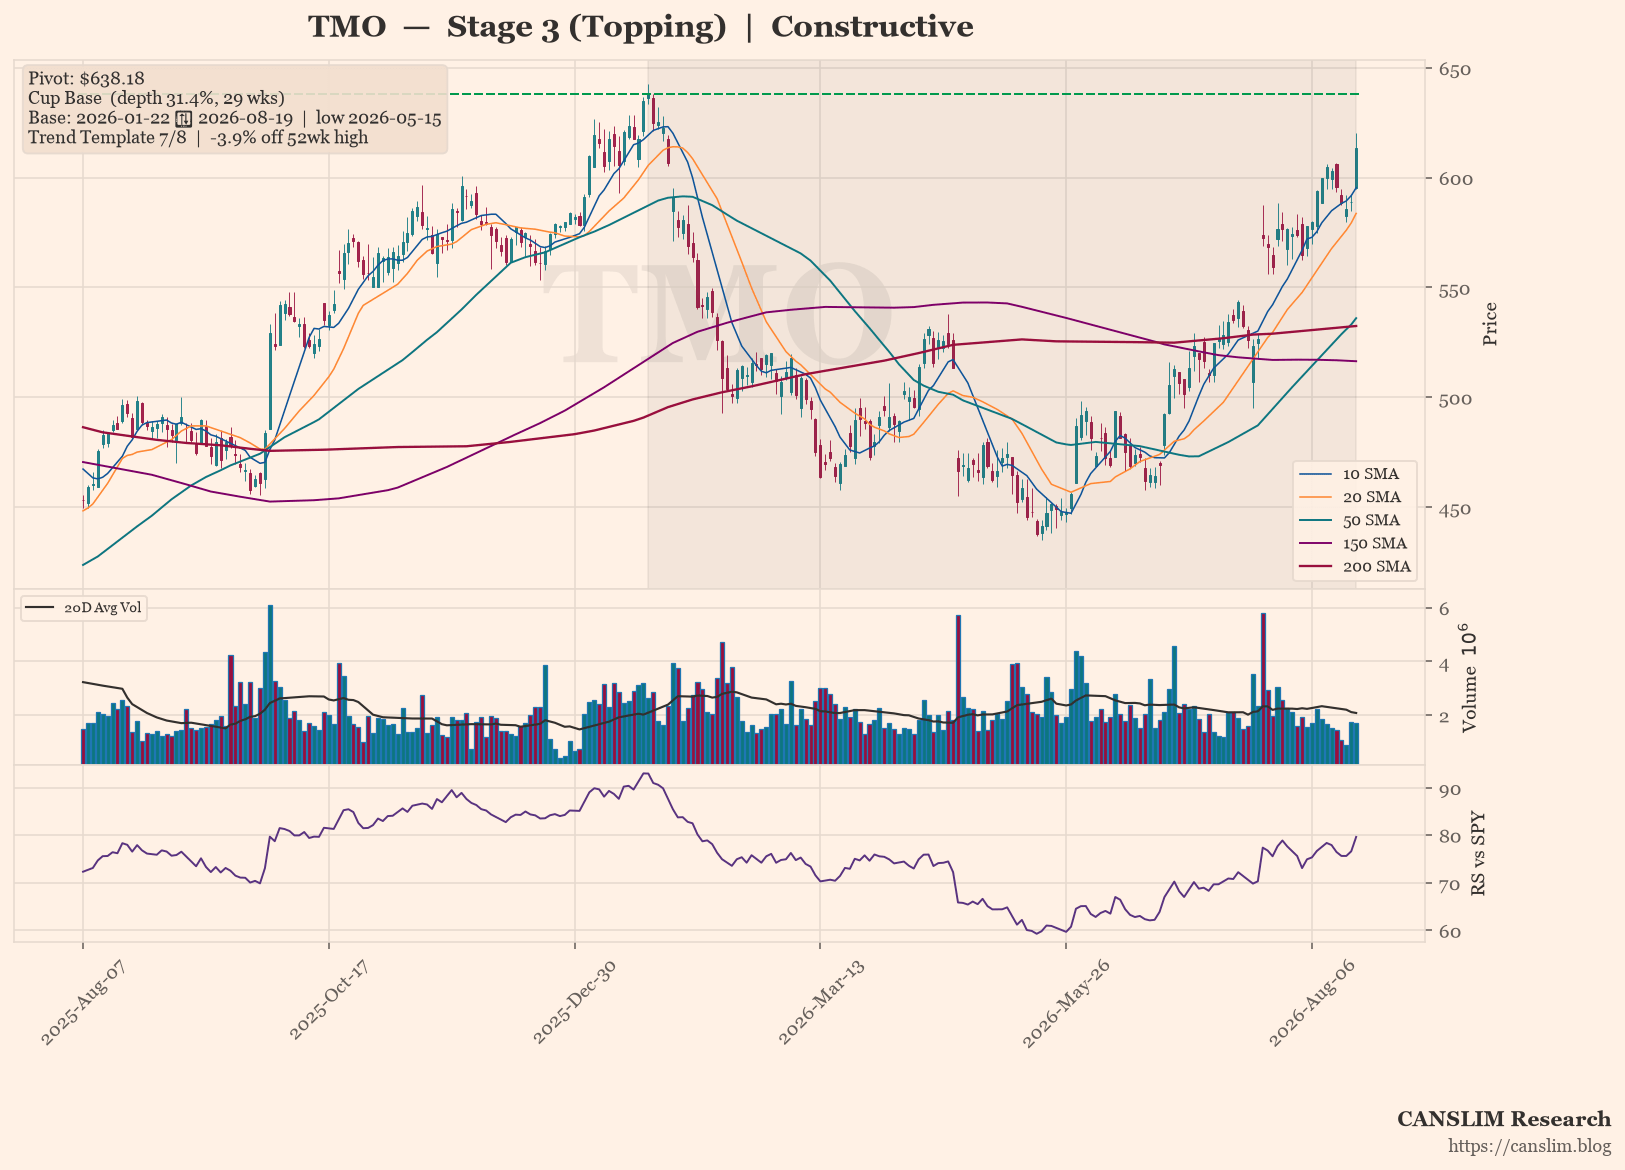
Thermo Fisher Scientific (TMO) is consolidating in a 29-week Cup Base pattern, with the stock closing at $613.54, just 3.9% below its 52-week high and near the $638.18 pivot. The technical setup is broadly constructive, passing 7 of 8 trend-template checks, including price above key moving averages and a strong relative-strength line.
However, the stock remains in Stage 3 (Topping), with price churning around a slightly declining 30-week moving average, and no VCP contraction sequence has been detected. Sentiment is constructive but awaits a confirmed breakout above the pivot to signal the start of a new advance.
Technical Analysis
As of 2026-08-19 · Close $613.54
Stage Analysis
Stage 3 (Topping) — Price churning around the 30-week MA — topping consolidation (30-week MA 6-week slope: -0.6%)
Detected Patterns — What the Market Is Watching
- Cup Base — depth 31.4%, length 29 weeks, pivot $638.18. Base formed from 2026-01-22 (left-side high) to 2026-08-19, with the low of $437.9 set on 2026-05-15

Subscribe to continue reading
Become a paid subscriber to get access to the rest of this post and other exclusive content.