 Eben@CANSLIM Research
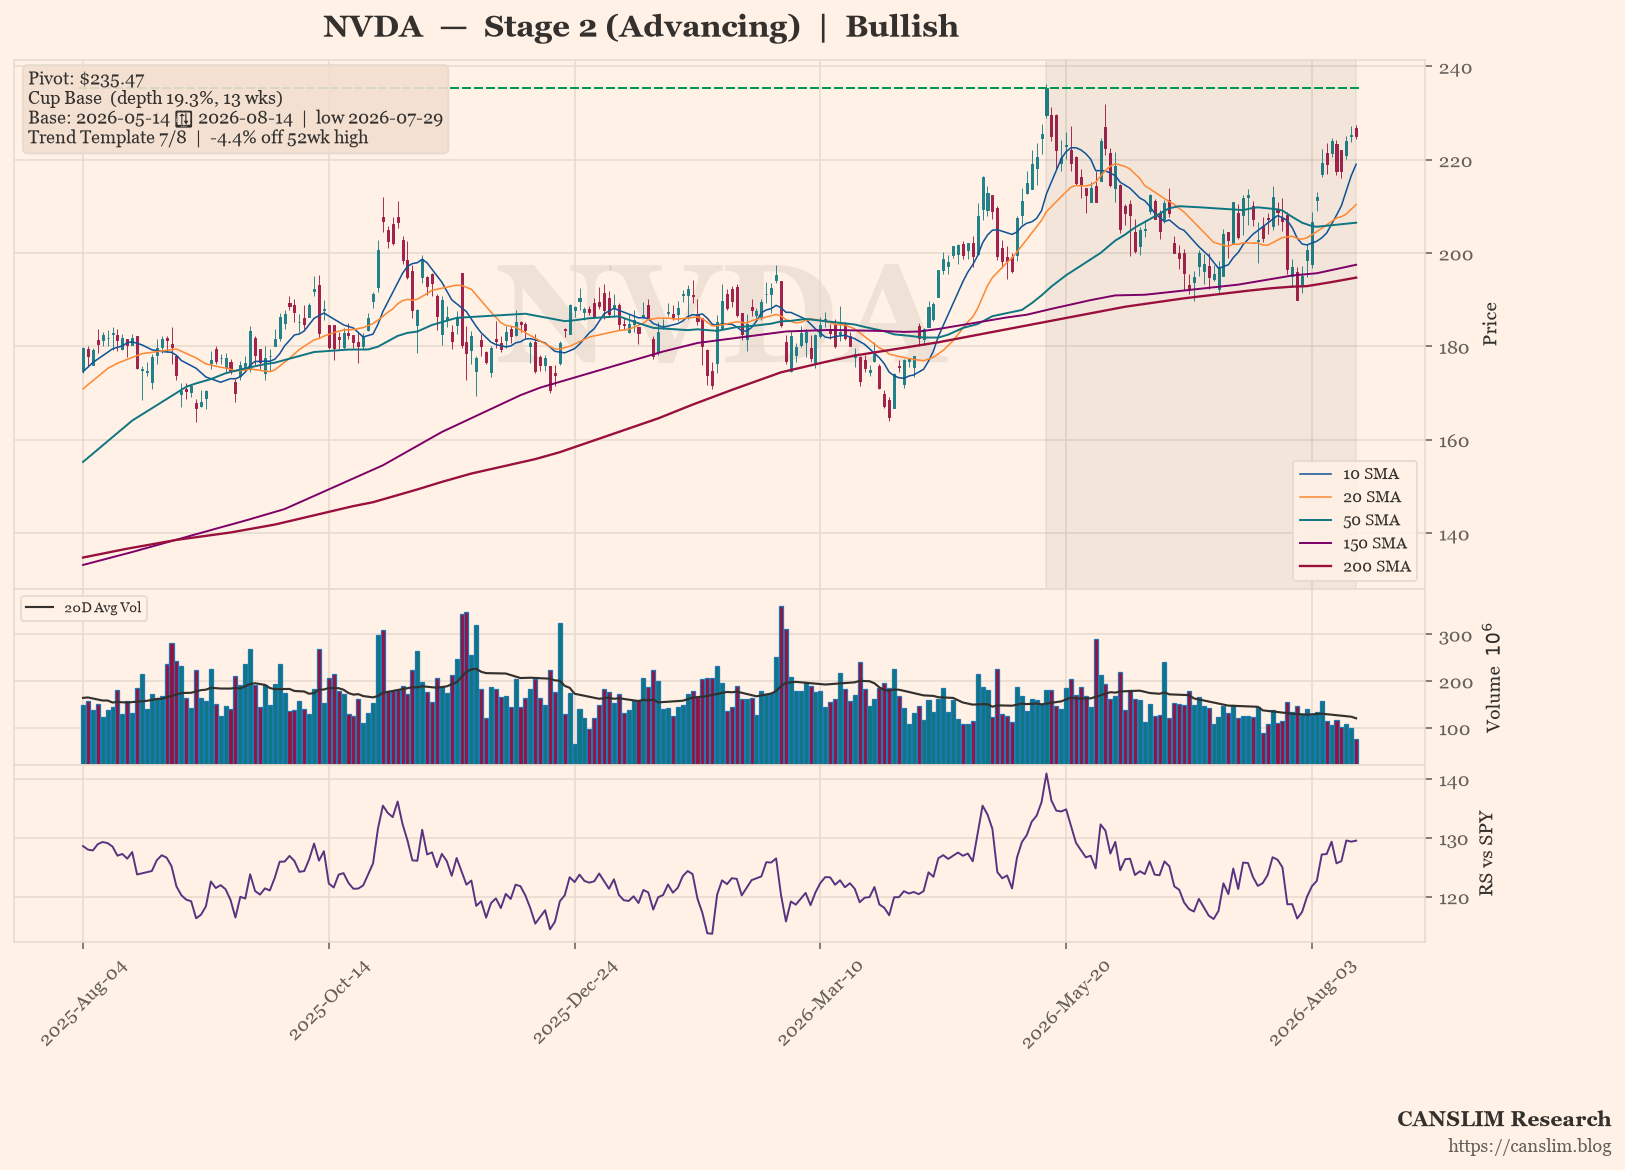
NVIDIA (NVDA) is consolidating in a 13-week Cup Base, with the stock holding above its rising 30-week moving average, confirming a Stage 2 advancing trend. The setup is bullish, as price sits just 4.4% below its 52-week high and 36.5% above its low, with 7 of 8 trend-template checks passing. The market is focused on the potential breakout above the $235.47 pivot, though the lack of a confirmed handle or volume dry-up suggests the base is still maturing.
Technical Analysis
As of 2026-08-14 · Close $225.16
Stage Analysis
Stage 2 (Advancing) — Price holding above a rising 30-week MA — uptrend intact (30-week MA 6-week slope: 2.23%)
Detected Patterns — What the Market Is Watching
- Cup Base — depth 19.3%, length 13 weeks, pivot $235.47. Base formed from 2026-05-14 (left-side high) to 2026-08-14, with the low of $190.01 set on 2026-07-29

Subscribe to continue reading
Become a paid subscriber to get access to the rest of this post and other exclusive content.