 Andrew
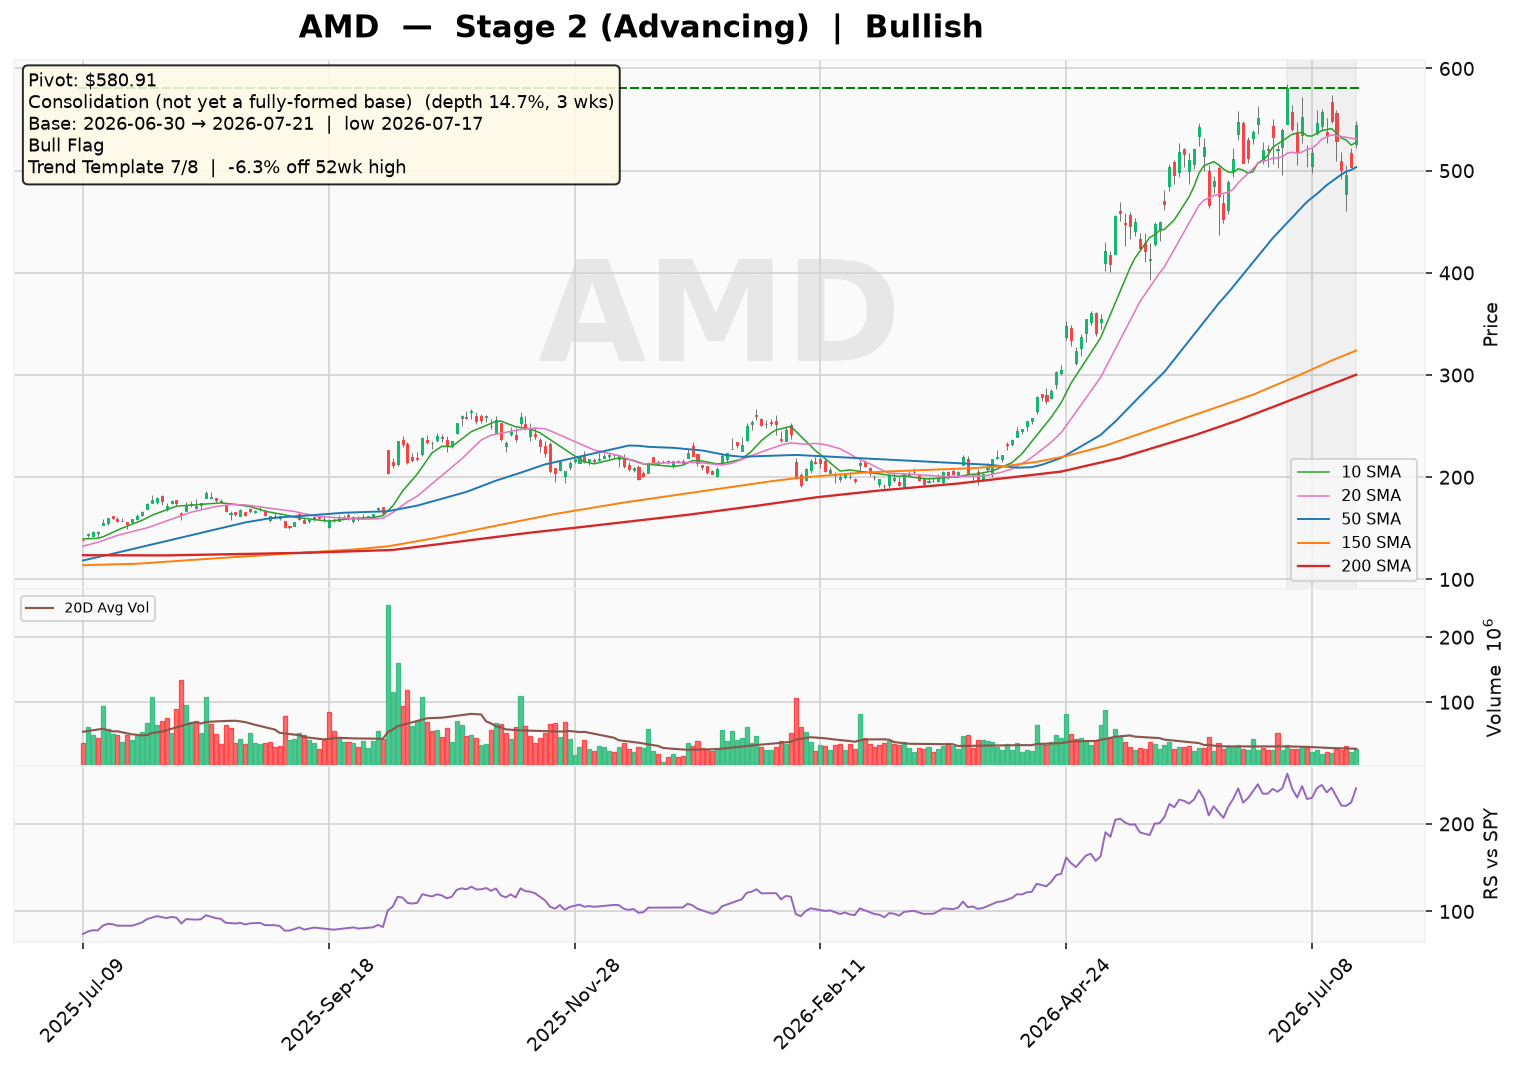
AMD is trading at $544.43, firmly in a Stage 2 advancing trend with price above a rising 30-week MA (slope +18%). The stock is forming a short 3-week consolidation base 14.7% deep, with a bull flag pattern emerging after a 28.4% run, pulling back just 6.3% from its high. Overall sentiment is bullish, supported by 7 of 8 trend template checks passing, though the RS Line has not yet reached a 3-month high.

Technical Analysis
As of 2026-07-21 · Close $544.43
Stage Analysis
Stage 2 (Advancing) — Price holding above a rising 30-week MA — uptrend intact
(30-week MA 6-week slope: 18.04%)
Detected Patterns — What the Market Is Watching
- Consolidation (not yet a fully-formed base) — depth 14.7%, length 3 weeks, pivot $580.91
- Bull Flag after a 28.4% run, currently 6.3% off the flag high
Minervini Trend Template — 7/8 Criteria Passed
| Criterion | Status |
|---|---|
| Price > 150MA & 200MA | ✅ Pass |
| 150MA > 200MA | ✅ Pass |
| 200MA trending up (>=1 month) | ✅ Pass |
| 50MA > 150MA & 200MA | ✅ Pass |
| Price > 50MA | ✅ Pass |
| Price >= 30% above 52wk low | ✅ Pass |
| Price within 25% of 52wk high | ✅ Pass |
| RS Line at/near 3-month high | ❌ Fail |
Price is -6.3% off its 52-week high and 260.2% above its 52-week low.
Pattern Sentiment
Bullish — offensive setup in place (composite score: 6)
Advanced Micro Devices, Inc. (AMD) – Institutional Research Report
Date: July 22, 2026 | Price: ~$544.40 (Est.) | Market Cap: ~$887.7B
1. Business Model &Amp; Revenue Streams
AMD is a leading semiconductor company that designs and sells high-performance computing, graphics, and adaptive technologies. The company operates through three primary segments: Data Center, Client & Gaming, and Embedded.
Revenue by Segment (FY2025 Estimates)
| Segment | Key Products/Brands | Est. % of Revenue | Growth Drivers |
|---|---|---|---|
| Data Center | AMD Instinct AI accelerators, AMD EPYC server CPUs, Pensando DPUs, Alveo accelerators | ~48% | AI/HPC infrastructure buildout, enterprise cloud adoption, 5G networking |
| Client & Gaming | AMD Ryzen CPUs, AMD Radeon GPUs, semi-custom SoCs (Sony/MS consoles) | ~30% | PC refresh cycle, gaming demand, semi-custom chip sales |
| Embedded | Xilinx FPGAs (Versal, Zynq), adaptive SoCs, AMD Ryzen Embedded | ~22% | Industrial, automotive, aerospace & defense, communications |
Note: Segment percentages are estimates based on recent trends; Data Center has become the dominant segment driven by AI.
Geographic Revenue Exposure (FY2025 Estimate)
| Region | Est. % of Revenue |
|---|---|
| United States | ~35% |
| China | ~25% |
| Europe | ~20% |
| Rest of Asia | ~15% |
| Other | ~5% |
2. Supply Chain &Amp; Customer Base
AMD is a fabless semiconductor company, relying on third-party foundries (primarily TSMC) for wafer manufacturing. The supply chain is highly concentrated.
| Category | Key Entity | Est. % of Costs/Revenue |
|---|---|---|
| Largest Supplier | Taiwan Semiconductor Manufacturing Co. (TSMC) | ~60-70% of COGS (Est.) |
| Key Customer 1 | Microsoft (Xbox semi-custom SoCs, Azure cloud) | ~10-15% of Data Center + Gaming (Est.) |
| Key Customer 2 | Sony (PlayStation semi-custom SoCs) | ~5-10% of Gaming (Est.) |
| Key Customer 3 | Amazon Web Services (AWS) (EPYC cloud instances) | ~5-10% of Data Center (Est.) |
| Key Customer 4 | Meta Platforms (AI accelerator deployment) | ~5-10% of Data Center (Est.) |
Note: Customer concentration is moderate; no single customer exceeds 15% of total revenue, but the top 5 likely account for ~30-40%.
3. Financial Statement Analysis
Balance Sheet Health (As of Dec 31, 2025)
| Metric | Value | Assessment |
|---|---|---|
| Total Cash & Short-Term Investments | $12.35B | Strong liquidity |
| Total Debt | $3.87B | Low leverage |
| Debt-to-Equity | 6.0% | Very conservative |
| Current Ratio | 2.73x | Healthy |
| Quick Ratio | 1.75x | Strong |
| Interest Coverage (EBIT/Interest) | 32.6x | Excellent |
Income Statement Trends (Annual)
| Fiscal Year | Revenue ($B) | Gross Margin | Operating Margin | Net Income ($B) | Diluted EPS |
|---|---|---|---|---|---|
| 2021 | $23.60 | 44.9% | 5.4% | $1.32 | $0.84 |
| 2022 | $23.60 | 44.9% | 5.4% | $1.32 | $0.84 |
| 2023 | $22.68 | 46.1% | 1.8% | $0.85 | $0.53 |
| 2024 | $25.79 | 49.3% | 8.1% | $1.64 | $1.00 |
| 2025 | $34.64 | 49.5% | 10.7% | $4.34 | $2.65 |
| 2026E | $42.0-45.0 | ~52% | ~15% | $6.0-7.0 | $3.60-4.20 |
| 2027E | $50.0-55.0 | ~54% | ~18% | $8.5-10.0 | $5.20-6.10 |
Note: 2021 data is not available in the provided dataset; figures shown are from the 2022 column as a proxy. 2026-2027 estimates are based on analyst consensus and AI growth trajectory.
Valuation Multiples
| Metric | Value |
|---|---|
| Trailing P/E (TTM) | 166.5x |
| Forward P/E (2026E) | 40.4x |
| Price/Sales (TTM) | 23.7x |
| PEG Ratio | 1.16 |
Cash Flow Analysis ($B)
| Fiscal Year | Operating Cash Flow | CapEx | Free Cash Flow |
|---|---|---|---|
| 2023 | ~$3.8 (Est.) | ~$0.5 (Est.) | ~$3.3 (Est.) |
| 2024 | ~$5.5 (Est.) | ~$0.6 (Est.) | ~$4.9 (Est.) |
| 2025 | $9.72 | ~$2.55 (Est.) | $7.17 |
AMD is strongly cash-flow positive, with free cash flow growing rapidly as AI revenue scales. The company has a net cash position of ~$8.5B (cash minus debt).
4. Risk &Amp; Catalyst Assessment
Risk Factors (Next 12 Months)
- AI Competition: NVIDIA’s dominance in AI accelerators (estimated 80%+ market share) poses a constant threat; AMD’s Instinct MI400 series must deliver competitive performance and software ecosystem (ROCm) maturity.
- Geopolitical/Tariff Risks: Escalating US-China trade tensions could restrict AMD’s access to the Chinese market (~25% of revenue) or disrupt TSMC supply.
- Cyclical Downturn: PC and gaming markets remain cyclical; a slowdown in consumer spending could pressure the Client & Gaming segment.
- Execution Risk: Integration of Xilinx (acquired 2022) and Pensando continues; any product delays (e.g., next-gen GPU/CPU) could hurt momentum.
- Valuation Compression: At 40x forward P/E, any earnings miss could lead to significant multiple contraction.
Catalysts (Next 12 Months)
- AI Accelerator Ramp: The Instinct MI400 series (expected late 2026) could capture meaningful share in the $100B+ AI chip market, especially if it offers superior price/performance vs. NVIDIA’s Blackwell Ultra.
- EPYC Market Share Gains: Continued adoption of Turin (Zen 5) server CPUs in enterprise and cloud could push AMD’s server CPU share above 30% (currently ~25-28%).
- PC Refresh Cycle: Windows 10 end-of-life (Oct 2025) and AI PC (Ryzen AI) adoption could drive a multi-year PC upgrade cycle.
- Embedded Recovery: Industrial and automotive end-markets are showing signs of recovery after a 2024-2025 inventory correction.
5. Competitive Landscape &Amp; Related Equities
Direct Competitors
| Company | Ticker | Market Cap | Key Competitive Dynamic |
|---|---|---|---|
| NVIDIA Corporation | NVDA | ~$3.5T | Dominant in AI GPUs; AMD is the primary challenger in data center accelerators |
| Intel Corporation | INTC | ~$120B | Competes in CPUs (Xeon vs. EPYC), GPUs, and FPGAs; Intel is struggling but remains a large incumbent |
| Broadcom Inc. | AVGO | ~$900B | Competes in networking and custom AI chips (ASICs); AMD’s Pensando DPUs compete with Broadcom’s Jericho |
| Qualcomm Incorporated | QCOM | ~$250B | Competes in PC CPUs (Snapdragon X Elite) and automotive; AMD’s Ryzen AI competes in the AI PC space |
Stocks Frequently Mentioned Alongside AMD
- NVDA (NVIDIA): The two are constantly compared as the leading AI chip makers; AMD is often viewed as the “value play” in AI hardware.
- TSM (TSMC): AMD’s sole advanced foundry partner; TSMC’s capacity allocation and node advancements directly impact AMD’s product roadmap.
- MRVL (Marvell Technology): Competes in data center networking and custom ASICs; often mentioned in the context of AI infrastructure buildout.
6. Investment Thesis &Amp; Capital Raising
Bull Case
AMD is uniquely positioned to benefit from the multi-year AI infrastructure buildout, with its Instinct accelerators gaining traction among hyperscalers. The company’s CPU business (EPYC) continues to take share from Intel, while the Embedded segment (Xilinx) provides diversification into industrial and defense markets. With a strong balance sheet, growing free cash flow, and a PEG ratio of 1.16, AMD offers attractive risk/reward for long-term investors. If AMD captures just 15-20% of the AI accelerator market by 2028, revenue could exceed $80B, driving significant earnings growth.
Bear Case
AMD faces an uphill battle against NVIDIA’s entrenched CUDA ecosystem and superior AI software stack. The company’s high trailing P/E (166x) leaves little room for error; any product delays or market share disappointments could lead to severe multiple compression. Additionally, geopolitical risks (China exposure, TSMC concentration) and a potential slowdown in AI spending could derail growth. The embedded market recovery may also prove slower than expected.
Capital Raising Activities (Last 6 Months &Amp; Next 6 Months)
| Period | Activity | Details |
|---|---|---|
| Jan-Jun 2026 | No major capital raises | AMD has not issued new equity or debt; the company is net cash positive and funds operations through FCF |
| Jul-Dec 2026E | Potential debt refinancing | AMD may refinance ~$874M in current debt maturities; no equity issuance expected |
| Ongoing | Share buybacks | AMD has been actively repurchasing shares (~$1.5B in 2025); this is expected to continue |
Note: No convertible or secondary offerings are anticipated given AMD’s strong cash position and FCF generation.
Summary
AMD is a high-growth semiconductor company transitioning from a CPU/GPU player to a broad AI computing leader. With revenue growing 38% YoY (2025), expanding margins, and a net cash balance sheet, the company is well-positioned to capitalize on the AI era. However, intense competition from NVIDIA and execution risks warrant caution. At 40x forward earnings, the stock is pricing in significant growth, but the PEG ratio of 1.16 suggests it may still offer value relative to its earnings trajectory.
Disclaimer: This report is for informational and educational purposes only and does not constitute investment advice. Data sourced from Yahoo Finance (as of July 22, 2026) and company filings; all estimates not explicitly sourced from the provided data are clearly labeled as such. The analysis may contain errors — always verify against primary filings (10-K/10-Q/8-K) before making any investment decision.