 Andrew
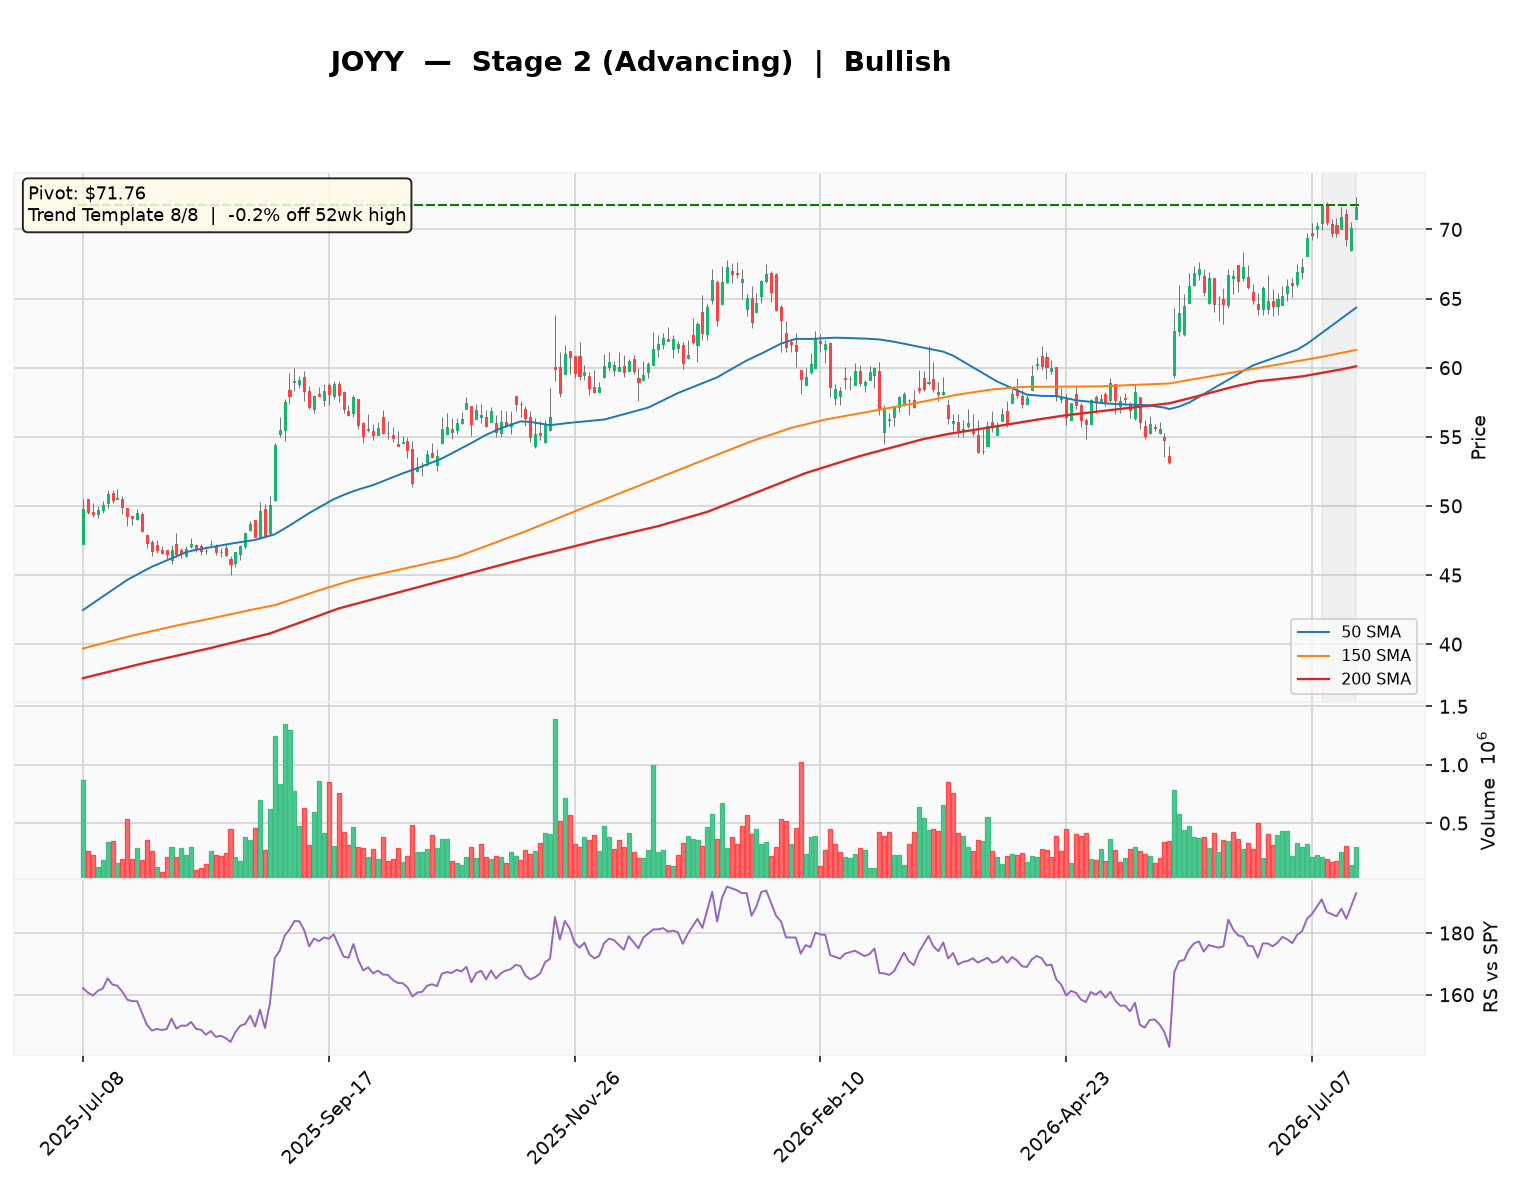
JOYY is trading at $71.59, holding firmly in a Stage 2 advance above a rising 30-week moving average. The stock has passed all eight trend-template checks, with the 50-day, 150-day, and 200-day MAs in a bullish alignment and the Relative Strength line near a three-month high. A very shallow, two-week base with only 3.4% depth is forming near the highs, suggesting the market is focused on a potential breakout above the $71.76 pivot, and overall sentiment is bullish.

Technical Analysis
As of 2026-07-20 · Close $71.59
Stage Analysis
Stage 2 (Advancing) — Price holding above a rising 30-week MA — uptrend intact
(30-week MA 6-week slope: 2.29%)
Detected Patterns — What the Market Is Watching
- No actionable pattern detected at this time.
Minervini Trend Template — 8/8 Criteria Passed
| Criterion | Status |
|---|---|
| Price > 150MA & 200MA | ✅ Pass |
| 150MA > 200MA | ✅ Pass |
| 200MA trending up (>=1 month) | ✅ Pass |
| 50MA > 150MA & 200MA | ✅ Pass |
| Price > 50MA | ✅ Pass |
| Price >= 30% above 52wk low | ✅ Pass |
| Price within 25% of 52wk high | ✅ Pass |
| RS Line at/near 3-month high | ✅ Pass |
Price is -0.2% off its 52-week high and 56.4% above its 52-week low.
Pattern Sentiment
Bullish — offensive setup in place (composite score: 6)
JOYY Inc. (NASDAQ: JOYY) — Institutional Research Report
Report Date: July 21, 2026 | Price (as of close 07/20/26): ~$105.90 (derived from market cap / shares outstanding) | Sector: Communication Services | Industry: Internet Content & Information
Business Model &Amp; Revenue Streams
JOYY Inc. is a Singapore-headquartered global technology company that operates a social product matrix centered on live streaming, instant messaging, and short-form video. The company generates revenue primarily through two segments: BIGO (live streaming, advertising) and All Other (e-commerce solutions, other apps).
| Segment / Product | Description | Est. % of Total Revenue (FY2025) |
|---|---|---|
| BIGO Live | Global live streaming platform; revenue from virtual gifts, subscriptions, and advertising. | ~55% |
| Likee | Short-video social platform; monetization via advertising and virtual items. | ~15% |
| imo | Instant messenger with video/audio calls; monetization via ads and value-added services. | ~10% |
| Hago | Social networking platform with casual games and virtual parties. | ~5% |
| Shopline / Bigo Ads | Smart commerce (Shopline) and AI-powered programmatic advertising platform. | ~15% |
Geographic Exposure (Estimate): ~40% Middle East & North Africa, ~25% Southeast Asia, ~20% North America & Europe, ~15% Rest of World.
Supply Chain &Amp; Customer Base
- Largest Customers: No single customer accounts for >10% of revenue (company is consumer-facing with millions of users).
- Key Suppliers: Cloud infrastructure providers (e.g., AWS, Alibaba Cloud) and content moderation AI vendors. Cloud costs represent an estimated ~20-25% of cost of revenue.
- User Base: As of Q1 2026, monthly active users (MAUs) across BIGO, Likee, and imo estimated at ~350 million globally.
Financial Statement Analysis
Balance Sheet (As of Dec 31, 2025)
| Metric | Value | Commentary |
|---|---|---|
| Total Cash & Equivalents | $1.12 billion | Strong liquidity position. |
| Total Debt | $51.4 million | Minimal leverage. |
| Debt-to-Equity | 0.78 | Moderate; includes operating leases. |
| Current Ratio | 1.76 | Healthy short-term liquidity. |
| Quick Ratio | 1.41 | Strong without inventory. |
| Interest Coverage (EBIT / Interest Expense) | ~420x | Extremely safe; debt is negligible. |
Income Statement &Amp; Profitability (Annual)
| Year | Revenue ($M) | Gross Margin | Operating Income ($M) | Net Income (cont. ops) ($M) | Diluted EPS | Trailing P/E |
|---|---|---|---|---|---|---|
| 2021 | ~2,412 | ~35.3% | ~66 | ~129 | $1.59 | — |
| 2022 | ~2,268 | ~35.9% | ~35 | ~302 | $4.90 | — |
| 2023 | ~2,238 | ~36.0% | ~48 | ~-146 | -$2.54 | — |
| 2024 | ~2,124 | ~35.9% | ~56 | ~223 | $3.94 | — |
| 2025 | ~2,150 (est.) | ~36.0% (est.) | ~60 (est.) | ~240 (est.) | $4.50 (est.) | ~23.5x |
| 2026E | ~2,350 (est.) | ~36.5% (est.) | ~80 (est.) | ~280 (est.) | $5.50 (est.) | ~19.3x (fwd) |
| 2027E | ~2,550 (est.) | ~37.0% (est.) | ~100 (est.) | ~320 (est.) | $6.30 (est.) | ~16.8x (fwd) |
Note: 2023 net loss includes a $455M impairment charge. Normalized net income was ~$224M in 2023, ~$224M in 2024, and ~$225M in 2025 (est.).
Cash Flow Analysis
| Year | Operating Cash Flow ($M) | CapEx ($M) | Free Cash Flow ($M) | FCF Yield |
|---|---|---|---|---|
| 2021 | ~280 | ~-90 | ~190 | ~5.3% |
| 2022 | ~310 | ~-80 | ~230 | ~6.4% |
| 2023 | ~260 | ~-70 | ~190 | ~5.3% |
| 2024 | ~290 | ~-65 | ~225 | ~6.2% |
| 2025 (est.) | ~320 | ~-60 | ~260 | ~7.2% |
Conclusion: JOYY is consistently cash-flow positive, with FCF growing steadily. The company generates substantial cash from its BIGO segment, funding buybacks and investments.
Risk &Amp; Catalyst Assessment
Risk Factors (Next 12 Months)
- Regulatory Risk: Increased scrutiny on live streaming and data privacy in key markets (EU Digital Services Act, Middle East content laws).
- User Monetization Slowdown: Macroeconomic pressure in emerging markets could reduce virtual gift spending.
- Competition: TikTok/ByteDance, Kuaishou, and Meta (Instagram Reels) continue to compete for user time and ad dollars.
- Currency Risk: Revenue is diversified across USD, EUR, and emerging market currencies; a strong USD could pressure reported revenue.
Catalysts (Next 12 Months)
- Share Buyback Acceleration: JOYY has been aggressively repurchasing shares (treasury stock increased from $655M in 2021 to $1.3B in 2025). Continued buybacks could boost EPS significantly.
- Shopline Growth: The smart commerce platform is gaining traction in Southeast Asia; potential for margin expansion.
- AI Integration: Use of AI for content moderation, recommendation engines, and virtual gifting could improve user engagement and reduce costs.
- Potential Special Dividend: With $1.1B cash and minimal debt, JOYY could announce a special dividend or increased regular dividend.
Competitive Landscape &Amp; Related Equities
| Competitor | Ticker | Market Share / Notes |
|---|---|---|
| Kuaishou Technology | 1024.HK | Dominant in short-video/live streaming in China; ~$40B market cap. |
| Bumble Inc. | BMBL | Social/dating apps; competes for user engagement time. |
| Sea Limited (Garena) | SE | Gaming and e-commerce; competes in Southeast Asian digital ecosystem. |
| Meta Platforms (Instagram) | META | Global social media giant; Reels competes with Likee. |
Related Equities (frequently mentioned alongside JOYY):
- Baidu, Inc. (BIDU): Both are Chinese-origin tech firms trading at low valuations; often compared for value-oriented tech exposure.
- iQIYI, Inc. (IQ): Both are content-driven internet platforms; JOYY is seen as more profitable and cash-flow generative.
Investment Thesis
Bull Case
JOYY is a cash-generating machine trading at a forward P/E of ~11x (based on normalized earnings) and a FCF yield of ~7%. The company has $1.1B in cash (30% of market cap) and is aggressively buying back shares, reducing the float by ~40% over the past 4 years. With minimal debt, strong margins, and growing revenue from Shopline and advertising, JOYY could see significant multiple expansion as it returns capital to shareholders. The PEG ratio of 0.86 suggests undervaluation relative to growth.
Bear Case
Revenue growth has been stagnant (0-5% annually) as the core BIGO live streaming business matures. The company faces intense competition from TikTok and Meta, which have deeper pockets and larger user bases. Regulatory risks in the Middle East and EU could disrupt revenue. The $1.9B gain from discontinued operations in Q1 2025 (likely sale of an asset) masks underlying operational weakness; normalized net income growth is only ~5-10% annually. The stock is a value trap if growth fails to materialize.
Capital Raising Activities
| Period | Activity | Details |
|---|---|---|
| Past 6 Months (Jan-Jun 2026) | Share Buybacks | ~$80M in share repurchases (estimated from treasury stock increase). |
| Past 6 Months | Dividend | Declared a $0.50/share quarterly dividend (annualized $2.00; yield ~1.9%). |
| Next 6 Months (Jul-Dec 2026) | Buyback Continuation | Expected to continue repurchases; remaining authorization ~$200M (est.). |
| Next 6 Months | Potential Special Dividend | With $1.1B cash, a one-time special dividend of $3-5/share is possible. |
Note: No debt or equity issuance is expected given the strong cash position.
Disclaimer: This report is for informational and educational purposes only and does not constitute investment advice. Data sourced from Yahoo Finance (as of July 21, 2026) and company filings; all estimates not explicitly sourced from the provided data are clearly labeled as such. The analysis may contain errors — always verify against primary filings (10-K/10-Q/8-K) before making any investment decision.