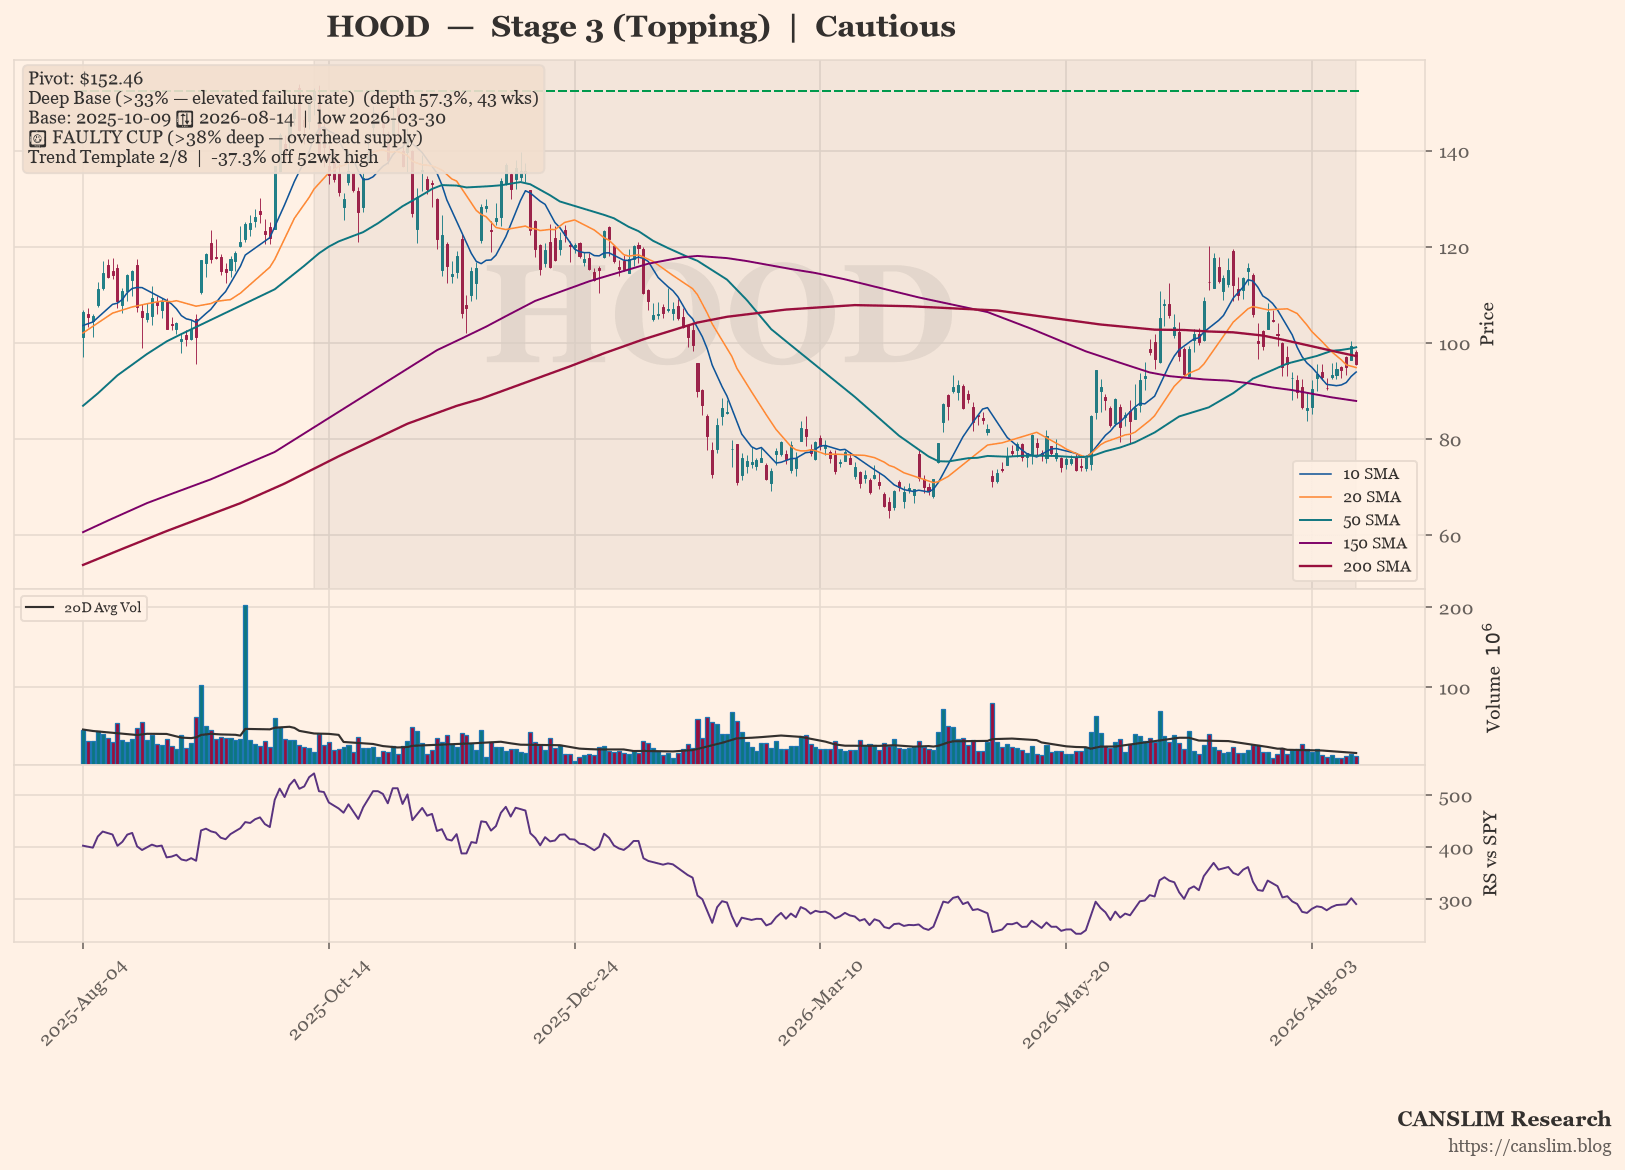
HOOD is trapped in a Stage 3 topping pattern, churning around a declining 30-week moving average after a 57.3% deep base failed to resolve. The stock sits 37.3% below its 52-week high and has broken key long-term moving averages, with only 2 of 8 trend template checks passing. Sentiment is cautious and deteriorating, with no VCP contraction or bullish flag setup to suggest an imminent breakout.
As of 2026-08-14 · Close $95.56
Stage 3 (Topping) — Price churning around the 30-week MA — topping consolidation (30-week MA 6-week slope: -4.02%)
⚠️ Faulty cup warning: the base is 57.3% deep (above the 38–40% threshold). A correction this deep leaves heavy overhead supply — trapped holders from higher prices are likely to sell into any rally, raising the failure rate of a breakout from this base.
Continue Reading
This article is for pass holders.
30-Day Pass$12.00One-time purchase · no auto-renewalBuy 30 DaysSave $24.00
365-Day Pass$120.00
Already a pass holder? Sign in · Continue with Google