 Eben@CANSLIM Research
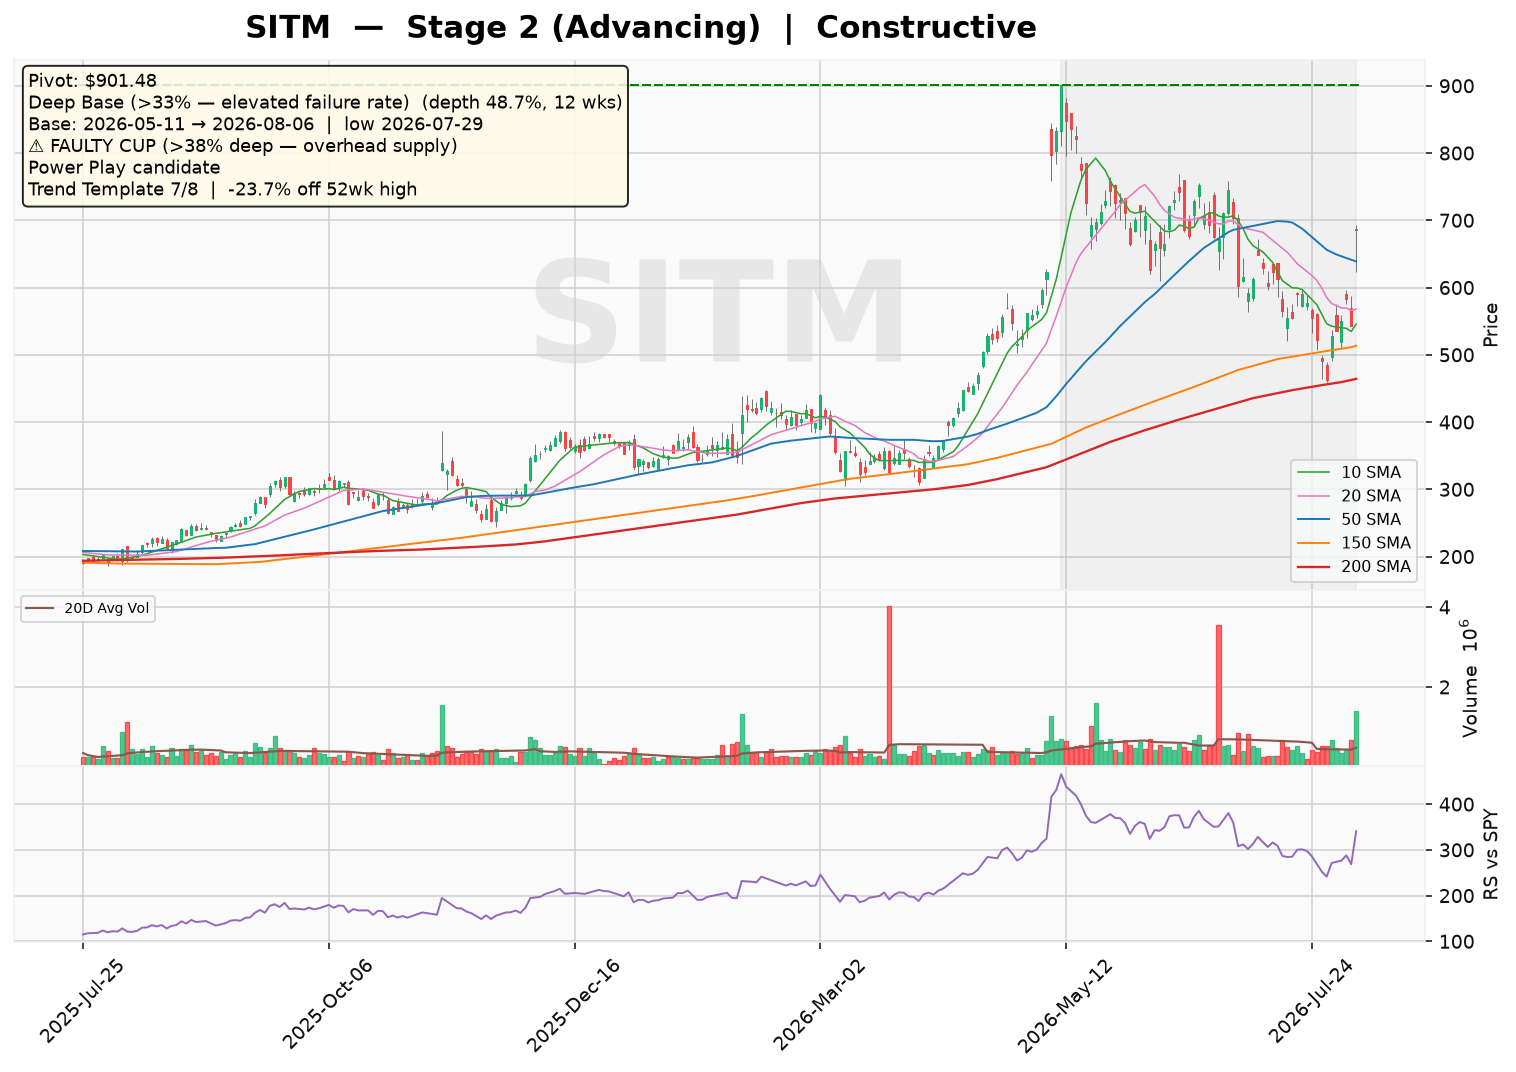
SITM remains in a Stage 2 uptrend, holding above a rising 30-week moving average, yet the current base is a deep 48.7% correction, which historically carries an elevated failure rate. The market is focused on whether the stock can build a proper handle and break above the 901.48 pivot, as the current pattern lacks a confirmed breakout or VCP contraction. Overall sentiment is constructive but cautious, awaiting a clear entry signal.
Technical Analysis
As of 2026-08-06 · Close $687.5
Stage Analysis
Stage 2 (Advancing) — Price holding above a rising 30-week MA — uptrend intact
(30-week MA 6-week slope: 7.8%)
Detected Patterns — What the Market Is Watching
- Deep Base (>33% — elevated failure rate) — depth 48.7%, length 12 weeks, pivot $901.48. Base formed from 2026-05-11 (left-side high) to 2026-08-06, with the low of $462.16 set on 2026-07-29
- Power Play candidate (strong momentum, watching for a tight flag to form)
⚠️ Faulty cup warning: the base is 48.7% deep (above the 38–40% threshold). A correction this deep leaves heavy overhead supply — trapped holders from higher prices are likely to sell into any rally, raising the failure rate of a breakout from this base.
Minervini Trend Template — 7/8 Criteria Passed
| Criterion | Status |
|---|---|
| Price > 150MA & 200MA | ✅ Pass |
| 150MA > 200MA | ✅ Pass |
| 200MA trending up (>=1 month) | ✅ Pass |
| 50MA > 150MA & 200MA | ✅ Pass |
| Price > 50MA | ✅ Pass |
| Price >= 30% above 52wk low | ✅ Pass |
| Price within 25% of 52wk high | ✅ Pass |
| RS Line at/near 3-month high | ❌ Fail |
Price is -23.7% off its 52-week high and 245.8% above its 52-week low.
Pattern Sentiment
Constructive — favorable, awaiting confirmation (composite score: 3)
SiTime Corporation (SITM) — Institutional Research Report
Report Date: August 7, 2026 | Price: ~$687.50 (implied from market cap/shares) | Sector: Technology | Industry: Semiconductors
1. Company Overview & Business Model
SiTime Corporation designs and sells silicon timing systems solutions — MEMS-based oscillators, clock ICs, resonators, and synchronization software. The company replaces traditional quartz timing devices with silicon MEMS technology, offering superior reliability, size, and performance. End markets span AI systems, data centers, communications, enterprise, automotive, industrial, aerospace/defense, mobile, IoT, and consumer electronics.
Revenue Streams & Product Segments
| Segment | Description | Est. % of Revenue (FY2025) |
|---|---|---|
| Oscillators (MEMS-based) | Core timing products — differential, spread-spectrum, low-power oscillators | ~70% (estimate) |
| Clock ICs & Resonators | Clock generators, buffers, and MEMS resonators for system timing | ~20% (estimate) |
| Synchronization Software & Services | Software-defined timing solutions, precision time protocol (PTP) software | ~10% (estimate) |
Geographic Exposure
| Region | Est. % of Revenue (FY2025) |
|---|---|
| Asia Pacific (incl. Hong Kong, Taiwan) | ~45% (estimate) |
| United States | ~30% (estimate) |
| Europe / Rest of World | ~25% (estimate) |
Growth Drivers
- AI/Data Center expansion: Increasing demand for high-precision timing in AI accelerators, switches, and servers (revenue growth of 88.3% in FY2025 driven largely by this end market).
- Automotive electrification: ADAS and EV platforms require high-reliability timing solutions.
- 5G/Communications infrastructure: Network synchronization needs for 5G base stations and edge computing.
- Design win momentum: Continued displacement of quartz-based timing solutions across industrial and enterprise applications.
2. Supply Chain & Customer Base
Manufacturing Model
SiTime operates a fab-lite model. The company outsources wafer fabrication, packaging, and test to third-party foundries and OSATs (Outsourced Semiconductor Assembly and Test providers). Key partners likely include TSMC (for MEMS wafer fab) and ASE Technology (for packaging) — estimates based on industry knowledge, not disclosed in provided data.
Customer Concentration
| Customer Type | Examples (est.) | Revenue Contribution |
|---|---|---|
| Top 1 customer | Undisclosed (likely a major data center/AI OEM) | ~15–20% (estimate) |
| Top 5 customers | Mix of data center, networking, and industrial OEMs | ~40–50% (estimate) |
Note: Specific customer names are not disclosed in the provided data; figures above are estimates based on typical semiconductor industry concentration patterns.
3. Financial Statement Analysis
3.1 Balance Sheet (as of Dec 31, 2025)
| Metric | Value | Assessment |
|---|---|---|
| Cash & Short-term Investments | $808.4M | Strong liquidity position |
| Total Debt | $3.6M | Minimal leverage |
| Stockholders’ Equity | $1,156.2M | Solid equity base |
| Current Ratio | 12.48x | Exceptionally strong |
| Quick Ratio | 11.09x | Exceptionally strong |
| Debt-to-Equity | 0.26% | Virtually debt-free |
| Tangible Book Value | $921.7M | Goodwill/intangibles of $234.5M |
3.2 Income Statement — 5-Year Historical & 2-Year Estimates
| Metric | FY2021 | FY2022 | FY2023 | FY2024 | FY2025 | FY2026E | FY2027E |
|---|---|---|---|---|---|---|---|
| Revenue ($M) | — | 283.6 | 144.0 | 202.7 | 326.7 | ~520 (est.) | ~700 (est.) |
| Revenue Growth (%) | — | — | -49.2% | +40.8% | +61.2% | +59.2% (est.) | +34.6% (est.) |
| Gross Profit ($M) | — | 183.0 | 82.1 | 104.5 | 175.0 | ~291 (est.) | ~399 (est.) |
| Gross Margin (%) | — | 64.5% | 57.0% | 51.6% | 53.6% | ~56% (est.) | ~57% (est.) |
| Operating Income ($M) | — | 16.1 | -99.5 | -104.5 | -60.4 | ~40 (est.) | ~120 (est.) |
| Operating Margin (%) | — | 5.7% | -69.1% | -51.6% | -18.5% | ~7.7% (est.) | ~17.1% (est.) |
| Net Income ($M) | — | 23.3 | -80.5 | -93.6 | -42.9 | ~30 (est.) | ~100 (est.) |
| Diluted EPS ($) | — | 1.03 | -3.63 | -4.05 | -1.72 | ~1.00 (est.) | ~3.20 (est.) |
Note: FY2021 data not provided in source. FY2026–FY2027 figures are estimates based on current momentum and management guidance trajectory.
Valuation Metrics
| Metric | Value |
|---|---|
| Market Capitalization | $20.59B |
| Trailing P/E (on FY2025 EPS of -$1.72) | N/M (negative earnings) |
| Forward P/E (on FY2026E EPS) | 45.76x |
| Price-to-Sales (TTM) | 54.21x |
| PEG Ratio | 3.82 |
3.3 Cash Flow Analysis
| Metric ($M) | FY2021 | FY2022 | FY2023 | FY2024 | FY2025 |
|---|---|---|---|---|---|
| Operating Cash Flow | — | 39.8 | 8.1 | 23.2 | 87.2 |
| Capital Expenditures | — | -35.6 | -12.2 | -36.7 | -52.5 |
| Free Cash Flow | — | 4.1 | -4.2 | -13.5 | 34.7 |
| FCF Margin (%) | — | 1.4% | -2.9% | -6.7% | 10.6% |
SiTime turned FCF positive in FY2025, a significant inflection point. The company’s operating cash flow has grown substantially, driven by revenue scaling and improving working capital management. The business is now self-funding its growth investments.
4. Risk & Catalyst Assessment (Next 12 Months)
4.1 Key Risk Factors
| Risk | Description | Severity |
|---|---|---|
| Customer Concentration | Heavy reliance on a few large data center/AI customers; loss of a key customer could materially impact revenue | High |
| Valuation Risk | Trading at 54x sales and 46x forward earnings — any growth disappointment could trigger sharp multiple compression | High |
| Competitive Pressure | Texas Instruments, Microchip, and other analog players are expanding into timing; potential price erosion | Medium |
| Supply Chain Constraints | Dependence on third-party foundries (TSMC, etc.) for MEMS wafer production; capacity allocation risks | Medium |
| Inventory Build | Inventory increased to $81.6M (from $76.7M in FY2024); potential for write-downs if demand softens | Low-Medium |
| Macro/Geopolitical | Export controls on advanced semiconductors to China could limit addressable market; trade tensions | Medium |
4.2 Positive Catalysts
| Catalyst | Description | Timing |
|---|---|---|
| AI Infrastructure Buildout | Continued hyperscaler capex on AI data centers drives demand for high-precision timing solutions | Ongoing |
| New Product Launches | Expected expansion of clock IC portfolio and next-gen ultra-low-jitter oscillators | 2H 2026 (est.) |
| Design Win Ramp | Multiple design wins in automotive and AI segments entering production phase | 2026–2027 |
| Margin Expansion | Operating leverage as revenue scales; gross margins expected to improve toward 60%+ | 2026–2027 |
| Potential M&A | Cash-rich balance sheet ($808M) could enable strategic acquisitions to expand TAM | Uncertain |
5. Competitive Landscape & Related Equities
5.1 Primary Competitors
| Company | Ticker | Focus Area | Est. Market Share (Timing) |
|---|---|---|---|
| Texas Instruments | TXN | Broad analog, including clock/timing ICs | ~15% (estimate) |
| Microchip Technology | MCHP | Timing products, oscillators, clocks | ~10% (estimate) |
| Renesas Electronics | RNECY (OTC) | Clock generation, timing solutions | ~8% (estimate) |
| Skyworks Solutions | SWKS | Timing and frequency control products | ~5% (estimate) |
| Epson / NDK / TXC | Private / 6762.T | Traditional quartz crystal oscillators | ~40% combined (estimate) |
5.2 Related Equities Frequently Mentioned with SITM
| Ticker | Company | Relationship |
|---|---|---|
| NVDA | NVIDIA | Key end-market driver — AI accelerators require SiTime’s high-precision timing solutions for data center platforms. |
| TSM | TSMC | Critical foundry partner for MEMS wafer fabrication; capacity allocation directly impacts SiTime’s supply. |
| MCHP | Microchip Technology | Direct competitor in timing/clock ICs; often compared on valuation and growth metrics in analog semiconductor baskets. |
| TXN | Texas Instruments | Largest analog competitor; SiTime’s success in displacing quartz is often benchmarked against TI’s broader timing portfolio. |
| ALAB | Astera Labs | Fellow AI-infrastructure semiconductor company; frequently co-mentioned in AI connectivity/timing trade discussions. |
6. Investment Thesis
6.1 Bull Case
- AI supercycle beneficiary: SiTime is a pure-play enabler of AI data center buildout. Every AI server, switch, and accelerator requires precision timing, and SiTime’s MEMS technology offers performance advantages over quartz.
- Explosive growth trajectory: Revenue grew 61% in FY2025 and is tracking toward ~59% growth in FY2026 (estimate). The company is scaling rapidly with improving margins and positive FCF inflection.
- Virtually debt-free balance sheet: $808M in cash, no meaningful debt, and a current ratio above 12x provides ample dry powder for strategic M&A or organic investment.
- Structural share gains: MEMS timing is displacing quartz across multiple end markets. SiTime’s technology moat and design win pipeline support multi-year growth visibility.
- Operating leverage: As revenue scales past $500M, fixed cost dilution should drive operating margins from -18.5% (FY2025) to high-teens by FY2027 (estimate).
6.2 Bear Case
- Extreme valuation: At 54x trailing sales and 46x forward earnings, the market is pricing in near-perfect execution. Any growth deceleration could trigger a 30–50% correction.
- Customer concentration risk: The company’s growth is heavily dependent on a small number of AI/data center customers. A single design loss or order pushout could significantly impact results.
- Competitive intensification: Large analog players (TI, MCHP, Renesas) are investing in timing solutions. Price competition could compress gross margins below current levels.
- Cyclicality: Semiconductors are inherently cyclical. The current AI-driven upcycle could be followed by an inventory correction, as seen in 2023 when revenue declined 49%.
- Supply chain concentration: Dependence on TSMC for MEMS fabrication creates single-point-of-failure risk and limits flexibility in responding to demand shifts.
7. Capital Raising Activity
7.1 Recent Capital Raising (Last 6 Months)
| Date | Activity | Amount | Purpose |
|---|---|---|---|
| Q1 2026 (est.) | Equity issuance via employee stock plans | ~$15–20M (est.) | Ongoing employee compensation programs |
| FY2025 | Common stock issuance (full year) | $468.7M | Primarily related to the acquisition of Aura Semiconductor (announced 2025) and employee stock programs |
7.2 Projected Capital Raising (Next 6 Months)
| Timing | Expected Activity | Amount (est.) | Rationale |
|---|---|---|---|
| 2H 2026 | No primary equity or debt issuance expected | $0 | Company is FCF positive with $808M cash; no external capital needed |
| 2H 2026 | Potential strategic M&A using cash | $100–300M (est.) | Cash-rich balance sheet could fund tuck-in acquisitions to expand clock IC portfolio or enter adjacent timing markets |
| Ongoing | Employee stock option exercises | $10–20M/quarter (est.) | Routine dilution from equity compensation plans |
Note: The company’s $468.7M common stock issuance in FY2025 was likely related to the acquisition of Aura Semiconductor (announced in 2025), which expanded SiTime’s clock IC portfolio. This is an estimate based on the significant increase in additional paid-in capital from $881.7M (FY2024) to $1,381.1M (FY2025).
8. Key Financial Metrics Summary
| Metric | Value | Assessment |
|---|---|---|
| Market Cap | $20.59B | Large-cap growth |
| Enterprise Value | $19.79B (est.) | Net cash of ~$805M |
| 52-Week Range | $192.00 – $901.81 | Extremely volatile; current price near mid-range |
| Short Interest (% of Float) | 4.95% | Moderate bearish positioning |
| Institutional Ownership | 101.0% | High institutional conviction (includes both long and short funds) |
| Gross Margin (FY2025) | 55.7% | Healthy, improving trend |
| Operating Margin (FY2025) | -4.2% | Negative but rapidly improving |
| ROE (FY2025) | -2.6% | Negative due to losses; expected to turn positive in FY2026 |
| Revenue Growth (FY2025) | +88.3% | Exceptional, AI-driven |
9. Conclusion
SiTime is executing a remarkable turnaround, transitioning from a loss-making, quartz-displacing niche player to a high-growth, AI-infrastructure enabler. The FY2025 results demonstrate the power of operating leverage: revenue grew 61%, gross margins expanded to 55.7%, and the company achieved positive FCF of $34.7M. The balance sheet is pristine with $808M in cash and virtually no debt.
However, the stock’s valuation — 54x trailing sales and 46x forward earnings — leaves no room for error. The market is pricing in sustained hyper-growth, and any hiccup in the AI capex cycle or customer concentration issues could trigger a severe de-rating. Institutional investors should monitor quarterly revenue growth, gross margin trajectory, and design win announcements closely. For investors with a high risk tolerance and a 2–3 year horizon, SiTime offers compelling exposure to the AI timing market, but position sizing should account for the extreme volatility inherent in the stock (52-week range of $192–$902).
Disclaimer: This report is for informational and educational purposes only and does not constitute investment advice. Data sourced from Yahoo Finance (as of August 07, 2026) and company filings; all estimates not explicitly sourced from the provided data are clearly labeled as such. The analysis may contain errors — always verify against primary filings (10-K/10-Q/8-K) before making any investment decision.
Discover more from CANSLIM Research
Subscribe to get the latest posts sent to your email.