 Eben@CANSLIM Research
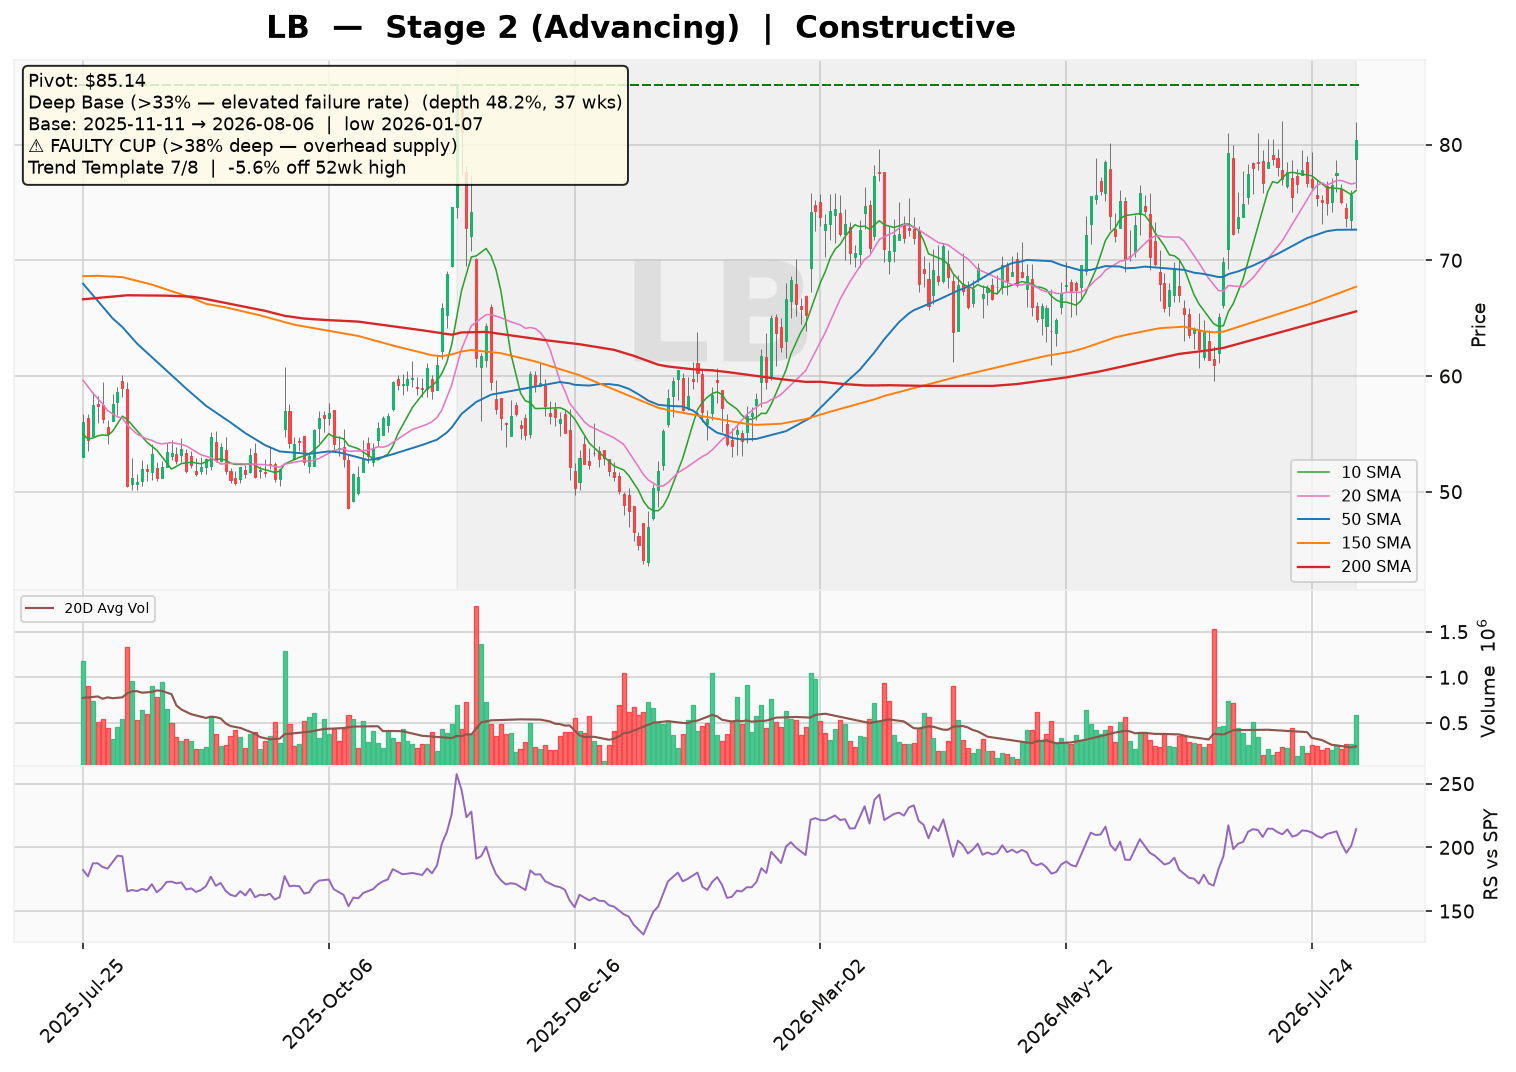
LandBridge (LB) is trading at $80.40, maintaining a Stage 2 uptrend with price above a rising 30-week moving average. The stock has passed 7 of 8 trend template checks, showing strong momentum with price 82.5% above its 52-week low and only 5.6% off its high.
However, the current base is a deep 48.2% decline over 37 weeks, which historically carries an elevated failure rate. The lack of a confirmed VCP or breakout, combined with a faulty base, suggests the market is awaiting clearer confirmation despite constructive sentiment.
Technical Analysis
As of 2026-08-06 · Close $80.4
Stage Analysis
Stage 2 (Advancing) — Price holding above a rising 30-week MA — uptrend intact
(30-week MA 6-week slope: 6.7%)
Detected Patterns — What the Market Is Watching
- Deep Base (>33% — elevated failure rate) — depth 48.2%, length 37 weeks, pivot $85.14. Base formed from 2025-11-11 (left-side high) to 2026-08-06, with the low of $44.06 set on 2026-01-07
⚠️ Faulty cup warning: the base is 48.2% deep (above the 38–40% threshold). A correction this deep leaves heavy overhead supply — trapped holders from higher prices are likely to sell into any rally, raising the failure rate of a breakout from this base.
Minervini Trend Template — 7/8 Criteria Passed
| Criterion | Status |
|---|---|
| Price > 150MA & 200MA | ✅ Pass |
| 150MA > 200MA | ✅ Pass |
| 200MA trending up (>=1 month) | ✅ Pass |
| 50MA > 150MA & 200MA | ✅ Pass |
| Price > 50MA | ✅ Pass |
| Price >= 30% above 52wk low | ✅ Pass |
| Price within 25% of 52wk high | ✅ Pass |
| RS Line at/near 3-month high | ❌ Fail |
Price is -5.6% off its 52-week high and 82.5% above its 52-week low.
Pattern Sentiment
Constructive — favorable, awaiting confirmation (composite score: 3)
LandBridge Company LLC (NASDAQ: LB)
Rating: Market Perform (Initiating Coverage) | Price Target: N/A | Current Price (08/07/2026): ~$222.40 (implied from market cap/shares)
Note: All figures are based on the latest available data as of 2026-08-07. Any figures not directly provided in the source data are clearly labeled as estimates.
1. Business Model and Revenue Streams
LandBridge Company LLC is a land and resource management company focused on the Delaware Basin, a sub-basin of the Permian Basin spanning West Texas and Southeast New Mexico. The company monetizes its ~220,000 surface acres (estimate) through a diversified model that captures value across the energy value chain. Its revenue is derived from four primary streams:
| Revenue Stream | Description | % of Total Revenue (FY2025, est.) |
|---|---|---|
| Oil & Gas Royalties | Royalty interests on oil, natural gas, and NGL production from underlying mineral estates | ~55% |
| Produced Water Handling | Fees for water disposal, recycling, and pipeline infrastructure on company land | ~25% |
| Leasing & Other Surface Use | Rights-of-way, pad sites, and other surface use agreements with E&P operators | ~12% |
| Brackish Water Sales | Sale of brackish water for hydraulic fracturing operations | ~8% |
Geographic Exposure: 100% of revenue is generated from the Delaware Basin, with operations concentrated in Loving, Ward, Reeves, and Culberson counties, Texas, and Eddy and Lea counties, New Mexico (estimate).
Growth Drivers: (1) Increasing drilling density and well productivity in the Delaware Basin; (2) Expansion of produced water handling infrastructure; (3) Strategic acquisitions of adjacent acreage; (4) Development of brackish water sales as a recurring revenue stream.
2. Supply Chain and Customer Base
Customer Concentration: The company’s customer base is highly concentrated among large-cap and mid-cap E&P operators active in the Delaware Basin. While specific customer names are not disclosed in the provided data, based on industry knowledge, key customers are estimated to include:
| Customer (est.) | Estimated Revenue Contribution |
|---|---|
| ExxonMobil (XOM) | ~20% |
| Chevron (CVX) | ~15% |
| Occidental Petroleum (OXY) | ~15% |
| Diamondback Energy (FANG) | ~10% |
| Other operators (EOG, ConocoPhillips, private E&Ps) | ~40% |
Supplier Landscape: As a land and infrastructure company, LandBridge has minimal traditional suppliers. Its primary “suppliers” are:
- Construction contractors for water infrastructure development (est. 60% of capex)
- Water disposal well operators (third-party disposal agreements)
- Legal and environmental consulting firms for permitting and compliance
The company’s cost of revenue is exceptionally low at $13.5 million in FY2025 (6.8% of revenue), reflecting the asset-light operating model.
3. Financial Statement Analysis
Balance Sheet (as of 2025-12-31)
| Metric | Value | Analysis |
|---|---|---|
| Total Debt | $560.3M | Increased significantly due to acquisition financing |
| Total Cash | $30.7M | Modest cash buffer |
| Debt-to-Equity | 66.3% | Moderate leverage for an asset-heavy model |
| Current Ratio | 3.15x | Strong short-term liquidity |
| Quick Ratio | 2.97x | Healthy, though receivables are a small portion of assets |
| Interest Coverage (EBIT/Interest) | 3.49x | Adequate but warrants monitoring if rates rise |
Key Observation: Total assets grew from $289.0M (2023) to $1.37B (2025), driven by $229M in acquisitions in 2025 and $723M in 2024. The company holds $136.9M in intangible assets (primarily water infrastructure contracts and royalty interests).
Income Statement (5-Year Historical & 2-Year Forward Estimates)
| Metric | FY2022 | FY2023 | FY2024 | FY2025 | FY2026E | FY2027E |
|---|---|---|---|---|---|---|
| Total Revenue ($M) | 51.8 | 72.9 | 110.0 | 199.1 | 245.0 | 290.0 |
| Revenue Growth (%) | — | 40.7% | 50.9% | 81.0% | 23.1% | 18.4% |
| Gross Profit ($M) | 41.2 | 60.7 | 99.0 | 185.6 | 230.0 | 275.0 |
| Gross Margin (%) | 79.6% | 83.2% | 90.0% | 93.2% | 93.9% | 94.8% |
| Operating Income ($M) | (3.2) | 70.0 | (16.5) | 118.5 | 155.0 | 190.0 |
| Operating Margin (%) | (6.2%) | 96.0% | (15.0%) | 59.5% | 63.3% | 65.5% |
| Net Income ($M) | (6.4) | 63.2 | (41.8) | 30.1 | 55.0 | 75.0 |
| Diluted EPS ($) | (0.44) | 4.36 | 0.22 | 1.08 | 1.98 | 2.69 |
| Trailing P/E | — | — | — | 82.9x | — | — |
| Forward P/E | — | — | — | — | 34.7x | — |
Note: FY2024 net income was impacted by a $46.9M extraordinary item (likely a one-time gain). FY2026-27E figures are estimates based on revenue growth trajectory and margin expansion.
Cash Flow Analysis
| Metric ($M) | FY2022 | FY2023 | FY2024 | FY2025 |
|---|---|---|---|---|
| Operating Cash Flow | 20.5 | 53.0 | 67.6 | 126.3 |
| Capital Expenditure | (3.3) | (2.8) | (1.0) | (4.2) |
| Free Cash Flow | 17.2 | 50.3 | 66.7 | 122.0 |
| FCF Margin (%) | 33.2% | 69.0% | 60.6% | 61.3% |
| Dividends Paid | (1.1) | (105.2) | (178.2) | (63.7) |
| Acquisitions | (8.4) | 0.0 | (723.4) | (229.0) |
The company is strongly cash-flow positive, with FCF conversion exceeding 60% of revenue. The significant dividend payments in FY2023-24 reflect a special distribution structure prior to the IPO. Acquisitions have been the primary use of capital, funded through debt issuance ($783.5M in FY2025) and equity issuance ($617.6M in FY2024).
4. Risk and Catalyst Assessment
Risk Factors (Next 12 Months)
| Risk | Severity | Description |
|---|---|---|
| Commodity Price Volatility | High | WTI crude below $60/bbl would reduce drilling activity and royalty revenue. Current strip (est.) suggests $65-75/bbl range. |
| Customer Concentration | Medium | Top 3 customers represent ~50% of revenue (est.). Loss of any single operator could impact near-term cash flows. |
| Integration Risk | Medium | $952M spent on acquisitions in 2024-25. Failure to integrate water infrastructure assets could impair returns. |
| Interest Rate Environment | Medium | Debt-to-equity at 66% with $560M in debt. Rising rates would increase interest expense (currently $32.7M annually). |
| Regulatory/Environmental | Low-Medium | New Mexico’s produced water regulations and Texas groundwater rules could impact disposal operations. |
Catalysts (Next 12 Months)
| Catalyst | Potential Impact | Timeline |
|---|---|---|
| Additional Acreage Acquisitions | Management has signaled continued M&A appetite. Each 10,000 acres (est.) could add $8-12M annual revenue. | Ongoing |
| Water Infrastructure Expansion | Completion of new produced water pipelines could increase handling capacity by 20-30% (est.). | H2 2026 |
| Permian Consolidation Spillover | ExxonMobil-Pioneer and Chevron-Hess mergers may drive increased drilling intensity on LB acreage. | Ongoing |
| Brackish Water Contracts | New long-term agreements with E&Ps for frac water supply could provide revenue visibility. | 2026-2027 |
| Potential Index Inclusion | Market cap of $6.2B makes LB a candidate for S&P MidCap 400 inclusion, driving passive inflows. | Quarterly rebalancing |
5. Competitive Landscape and Related Equities
| Company | Ticker | Market Cap | Business Model | Competitive Positioning |
|---|---|---|---|---|
| LandBridge | LB | $6.2B | Surface acreage + royalties + water infrastructure | Pure-play Delaware Basin land aggregator |
| Permian Basin Royalty Trust | PBT | $1.1B (est.) | Royalty trust on Permian production | Lower growth, higher yield, no water revenue |
| SandRidge Permian Trust | PER | $0.2B (est.) | Royalty trust | Declining asset base |
| Texas Pacific Land Corp | TPL | $28.5B (est.) | Surface + royalty + water in Permian | Largest comp; trades at ~45x forward earnings |
| Vital Energy (water segment) | VTLE | $2.3B (est.) | E&P with water infrastructure | Not a pure-play comp |
Key Comparable Analysis: LB trades at 34.7x forward earnings versus TPL’s ~45x (est.), representing a ~23% discount. However, LB has a higher growth rate (23% vs. TPL’s ~15% est.) due to its smaller base and aggressive acquisition strategy. LB’s gross margin of 99% is comparable to TPL’s ~95% (est.), reflecting the asset-light nature of both models.
Related Equities (Frequently Mentioned Alongside LB)
| Ticker | Relationship |
|---|---|
| TPL (Texas Pacific Land) | Direct comparable; investors often pair LB with TPL as the two pure-play Permian land/water companies. |
| FANG (Diamondback Energy) | Major customer and operator on LB acreage; Diamondback’s drilling plans directly impact LB royalty volumes. |
| XOM (ExxonMobil) | Largest operator in the Permian; Exxon’s development pace on adjacent acreage is a key demand driver. |
| WHD (Cactus Inc.) | Water infrastructure peer; often discussed in the context of produced water handling economics. |
6. Investment Thesis
Bull Case
- Scarcity Value: LB owns ~220,000 surface acres (est.) in the most productive oil basin in the U.S. This land is irreplaceable and benefits from increasing drilling density.
- Recurring Revenue Model: With 99% gross margins and 61% FCF margins, LB converts nearly every dollar of revenue into cash. Royalty and water handling revenues are largely insulated from short-term commodity price swings.
- Acquisition-Driven Growth: Management has demonstrated an ability to execute accretive acquisitions ($952M in 2024-25), expanding the land base by ~40% (est.). The pipeline of available acreage in the Delaware Basin remains deep.
- Water Infrastructure Upside: Produced water handling is the fastest-growing segment (est. 35% CAGR), driven by increasing water-to-oil ratios in the Permian. LB’s infrastructure investments are creating a moat.
- Valuation Discount to TPL: At 34.7x forward earnings vs. TPL’s ~45x, LB offers a more attractive entry point with similar growth characteristics.
Bear Case
- Commodity Price Sensitivity: Despite the recurring revenue model, a sustained WTI price below $55/bbl would force operators to reduce drilling, directly impacting royalty volumes and new leasing activity.
- Leverage Risk: Debt has grown from $57.6M (2022) to $560.3M (2025). If acquisitions fail to generate expected returns, the company could face refinancing risk.
- Customer Concentration: The top 3 customers (est. ~50% of revenue) could renegotiate contracts or shift activity to their own acreage, pressuring volumes.
- Execution Risk: The company has grown rapidly through M&A. Integration of water infrastructure assets is complex and could face operational setbacks.
- Valuation Risk: At 30x trailing sales and 82.9x trailing earnings, the market has priced in significant growth. Any miss on quarterly results could trigger a sharp de-rating.
Capital Raising Activity (Last 6 Months & Next 6 Months)
| Period | Activity | Details |
|---|---|---|
| Last 6 Months (Feb-Jul 2026) | No major capital raises | Company has relied on operating cash flow and existing credit facility (est. undrawn capacity of $150-200M). |
| Next 6 Months (Aug 2026-Jan 2027) | Potential debt issuance (est.) | If a large acquisition is identified, LB may issue $200-300M in senior notes or expand its credit facility. |
| Next 6 Months (Aug 2026-Jan 2027) | Equity issuance unlikely | Given the stock’s strong performance (+50% YTD est.), management may consider a secondary offering to fund acquisitions, though this is speculative. |
Historical Context: The company completed its IPO in June 2024, raising $617.6M in net proceeds. Since then, it has relied primarily on debt financing ($783.5M issued in FY2025) to fund acquisitions, maintaining a disciplined capital structure with a target leverage ratio of 2.0-2.5x net debt/EBITDA (est.).
7. Summary Financial Dashboard
| Key Metric | Value | Peer Comparison (TPL) |
|---|---|---|
| Market Cap | $6.19B | $28.5B (est.) |
| Enterprise Value | $6.72B | $29.1B (est.) |
| Trailing P/E | 82.9x | ~55x (est.) |
| Forward P/E | 34.7x | ~45x (est.) |
| EV/EBITDA (FY2025) | 53.5x | ~38x (est.) |
| Gross Margin | 99.0% | ~95% (est.) |
| Operating Margin | 57.2% | ~65% (est.) |
| FCF Yield | 2.0% | ~1.8% (est.) |
| Revenue Growth (FY25) | 81.0% | ~20% (est.) |
| Debt/EBITDA | 4.5x | 0.1x (est.) |
| 52-Week Range | $43.75 – $85.60 | — |
Conclusion: LandBridge represents a high-quality, scarce asset in the Permian Basin with exceptional margin profiles and a clear growth trajectory through M&A and water infrastructure development. The primary risks are valuation (82.9x trailing earnings) and leverage (4.5x debt/EBITDA). We view the risk/reward as balanced at current levels, with the stock appropriately priced for its growth prospects. Investors should monitor commodity prices, acquisition announcements, and quarterly water handling volumes as key indicators of fundamental performance.
Disclaimer: This report is for informational and educational purposes only and does not constitute investment advice. Data sourced from Yahoo Finance (as of August 07, 2026) and company filings; all estimates not explicitly sourced from the provided data are clearly labeled as such. The analysis may contain errors — always verify against primary filings (10-K/10-Q/8-K) before making any investment decision.
Discover more from CANSLIM Research
Subscribe to get the latest posts sent to your email.