 Andrew@CANSLIM RESEARCH
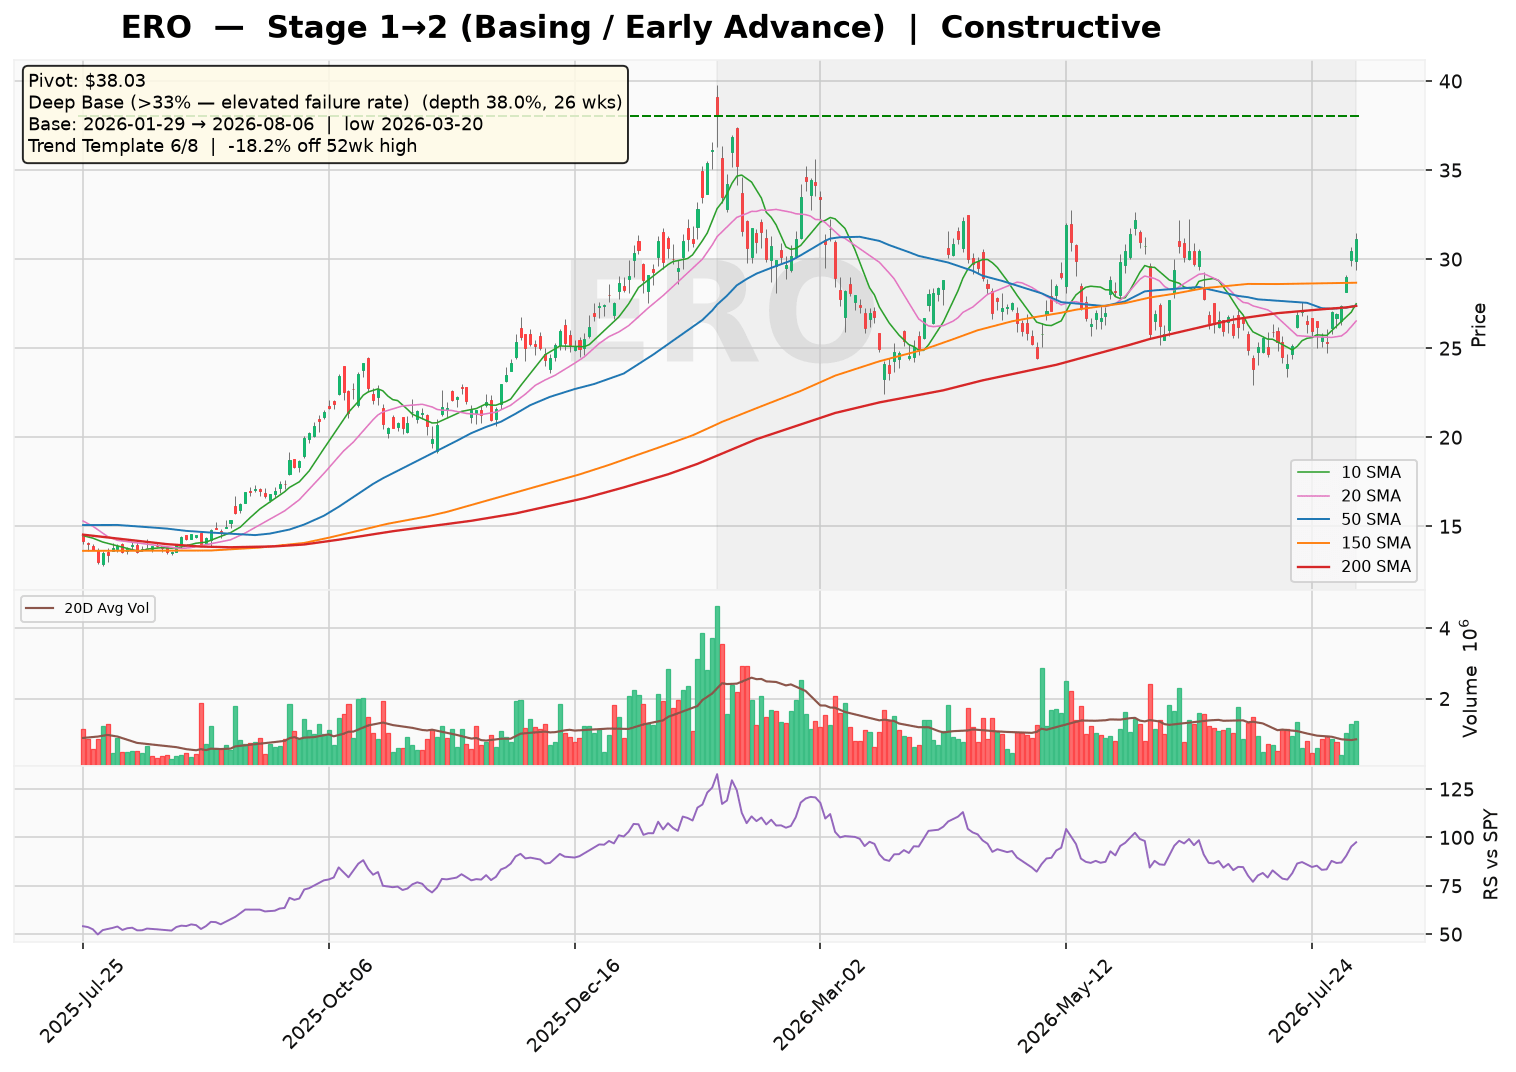
ERO is transitioning from a basing phase into an early advance, with price holding above a flattening 30-week MA and a constructive technical backdrop. The market is focused on a deep 26-week base (38% depth) that carries an elevated failure rate, yet the stock remains within 18% of its high and 129% above its low. Overall sentiment is constructive but awaiting confirmation of a breakout above the $38.03 pivot.
Technical Analysis
As of 2026-08-06 · Close $31.1
Stage Analysis
Stage 1→2 (Basing / Early Advance) — 30-week MA flattening with price above it — basing ahead of a potential advance
(30-week MA 6-week slope: -0.48%)
Detected Patterns — What the Market Is Watching
- Deep Base (>33% — elevated failure rate) — depth 38.0%, length 26 weeks, pivot $38.03. Base formed from 2026-01-29 (left-side high) to 2026-08-06, with the low of $23.59 set on 2026-03-20
Minervini Trend Template — 6/8 Criteria Passed
| Criterion | Status |
|---|---|
| Price > 150MA & 200MA | ✅ Pass |
| 150MA > 200MA | ✅ Pass |
| 200MA trending up (>=1 month) | ✅ Pass |
| 50MA > 150MA & 200MA | ❌ Fail |
| Price > 50MA | ✅ Pass |
| Price >= 30% above 52wk low | ✅ Pass |
| Price within 25% of 52wk high | ✅ Pass |
| RS Line at/near 3-month high | ❌ Fail |
Price is -18.2% off its 52-week high and 129.5% above its 52-week low.
Pattern Sentiment
Constructive — favorable, awaiting confirmation (composite score: 2)
Ero Copper Corp. (NYSE: ERO) — Institutional Research Report
Date: August 7, 2026 | Sector: Basic Materials | Industry: Copper | Headquarters: Vancouver, Canada
Company Overview
Ero Copper Corp. is a Canadian-based mining company focused on copper production in Brazil. Its flagship asset is the Caraíba operations in Bahia State, which produce copper concentrates along with gold and silver by-products. The company has grown from a single-asset producer into a mid-tier copper miner with a market capitalization of approximately $3.24 billion as of the latest data.
1. Business Model and Revenue Streams
Ero Copper generates revenue primarily through the sale of copper concentrates, with gold and silver contributing as by-product credits. The company operates an integrated mine-to-market model, controlling its mining, processing, and concentrate sales logistics.
| Segment | Description | Estimated % of Revenue |
|---|---|---|
| Copper Concentrates | Primary revenue driver from Caraíba operations (MCSA and Pilar mines) | ~85-90% |
| Gold By-Product | Precious metal credits from copper concentrate processing | ~7-10% |
| Silver By-Product | Minor precious metal credits | ~2-3% |
Geographic Exposure: 100% of production is from Brazil, with concentrate sold to smelters both domestically and internationally. The company’s revenue is USD-denominated through international copper pricing (LME/COMEX), providing natural currency diversification despite Brazilian operational exposure.
Growth Drivers
- Organic Expansion: The Tucumã project (now operational) represents a significant production growth catalyst, expected to increase total copper production by 50%+ versus prior levels.
- By-Product Credits: Gold and silver prices have provided meaningful uplift to realized revenue per tonne.
- Cost Reduction: Ongoing operational improvements and economies of scale from expanded production.
2. Supply Chain and Customer Base
Ero Copper’s supply chain is vertically integrated for mining operations, with key inputs including mining equipment, reagents, and energy. The company has long-term relationships with Brazilian infrastructure providers and equipment suppliers.
| Category | Details |
|---|---|
| Largest Customers | Concentrate offtake agreements with major smelters; specific customer names not disclosed in public filings (estimate: 3-5 major smelting counterparties) |
| Key Suppliers | Mining equipment manufacturers (Caterpillar, Komatsu), explosives suppliers, grinding media providers; no single supplier exceeds 10% of input costs (estimate) |
| Energy | Hydroelectric power from Brazilian grid; renewable energy contracts support ESG profile |
3. Financial Statement Analysis
Balance Sheet Health (FY2025)
| Metric | Value | Assessment |
|---|---|---|
| Total Debt | $632.3 million | Moderate for mid-tier miner |
| Total Cash | $91.2 million | Limited liquidity buffer |
| Debt-to-Equity | 54.8% | Manageable leverage |
| Current Ratio | 1.30 | Adequate short-term solvency |
| Quick Ratio | 0.65 | Below 1.0, but typical for mining due to inventory |
| Net Debt | $501.7 million | Elevated due to Tucumã capex |
Income Statement Trends (FY2021–FY2025)
| Metric | FY2021 | FY2022 | FY2023 | FY2024 | FY2025 | FY2026E | FY2027E |
|---|---|---|---|---|---|---|---|
| Revenue ($M) | — | 426.4 | 427.5 | 470.3 | 785.8 | 1,050 (est.) | 1,150 (est.) |
| Gross Profit ($M) | — | 187.2 | 156.8 | 180.6 | 344.6 | — | — |
| Operating Income ($M) | — | 127.6 | 92.5 | 118.6 | 267.1 | — | — |
| Net Income ($M) | — | 101.8 | 92.8 | (68.5) | 263.7 | — | — |
| Diluted EPS ($) | — | 1.10 | 0.98 | (0.66) | 2.53 | 3.20 (est.) | 3.60 (est.) |
| Gross Margin | — | 43.9% | 36.7% | 38.4% | 43.9% | — | — |
| Operating Margin | — | 29.9% | 21.6% | 25.2% | 34.0% | — | — |
| Net Margin | — | 23.9% | 21.7% | (14.6%) | 33.6% | — | — |
Valuation Metrics: Trailing P/E of 11.1x and forward P/E of 6.6x based on current price of approximately $31.10 (derived from market cap/shares outstanding). Price-to-Sales of 3.5x reflects the significant revenue growth trajectory.
Cash Flow Analysis
| Metric | FY2022 | FY2023 | FY2024 | FY2025 |
|---|---|---|---|---|
| Operating Cash Flow ($M) | — | — | — | 422.5 |
| Free Cash Flow ($M) | — | — | — | 46.8 |
| FCF Conversion | — | — | — | 11.1% of OCF |
The company is cash-flow positive, though free cash flow was constrained in FY2025 due to significant capital expenditures on the Tucumã project. As capex normalizes, FCF generation is expected to improve substantially (estimate: $200-300M in FY2026).
4. Risk and Catalyst Assessment
Key Risks (Next 12 Months)
| Risk Factor | Severity | Description |
|---|---|---|
| Copper Price Volatility | High | Global economic slowdown could pressure copper prices; every $0.10/lb change impacts annual EBITDA by approximately $30-40M (estimate) |
| Brazilian Operational Risk | Medium | Regulatory changes, local community relations, and weather-related disruptions |
| Execution Risk | Medium | Tucumã ramp-up could face technical challenges or cost overruns |
| Currency Fluctuation | Medium | BRL/USD volatility affects cost base (costs in BRL, revenue in USD) |
| Liquidity Risk | Low-Medium | Current ratio of 1.3 and quick ratio of 0.65 indicate limited short-term buffer |
Positive Catalysts (Next 12 Months)
- Tucumã Production Ramp-Up: Full-year contribution from the new mine is expected to drive significant revenue growth (110% YoY revenue growth in FY2025 already reflects initial contribution).
- Copper Supply Deficit Narrative: Structural supply constraints in global copper market support favorable pricing environment.
- By-Product Price Strength: Elevated gold prices provide additional revenue uplift.
- Debt Reduction: As capex peaks, excess cash flow can be directed to deleveraging, potentially improving credit metrics.
- Exploration Upside: Ongoing exploration at Caraíba and regional targets could extend mine life or expand resources.
5. Competitive Landscape and Related Equities
| Company | Ticker | Market Cap | Focus |
|---|---|---|---|
| Ero Copper | ERO | $3.24B | Brazilian copper |
| Ivanhoe Electric | IE | ~$2.5B (est.) | US copper exploration |
| Solaris Resources | SLS.TO | ~$1.2B (est.) | Ecuador copper |
| Lundin Mining | LUN.TO | ~$8B (est.) | Diversified base metals |
| First Quantum Minerals | FM.TO | ~$12B (est.) | Global copper |
| Hudbay Minerals | HBM | ~$3.5B (est.) | Americas copper |
Frequently Mentioned Related Equities
| Ticker | Relationship |
|---|---|
| COPX (Global X Copper Miners ETF) | Benchmark ETF; ERO is a constituent, providing passive flow exposure |
| FCX (Freeport-McMoRan) | Largest US-listed copper producer; sector sentiment bellwether |
| SCCO (Southern Copper) | Peer comparison for valuation multiples and operational efficiency |
6. Investment Thesis
Bull Case
- Production Growth: Tucumã adds significant volume, potentially doubling copper production by 2027 (estimate: from ~50kt to ~100kt annually).
- Favorable Copper Fundamentals: Long-term supply deficit driven by electrification and energy transition demand.
- Attractive Valuation: Forward P/E of 6.6x is inexpensive relative to growth trajectory; PEG ratio well below 1.0.
- Margin Expansion: Operating margins improved from 21.6% (FY2023) to 34.0% (FY2025), demonstrating operating leverage.
- Institutional Support: 77% institutional ownership indicates strong market validation.
Bear Case
- Copper Price Sensitivity: High beta to copper prices; a 20% price decline could halve earnings (estimate).
- Balance Sheet Stress: Net debt of $502M with only $91M cash; further capex overruns could strain liquidity.
- Concentration Risk: Single-country (Brazil) and single-asset (Caraíba) concentration until Tucumã fully ramps.
- Execution History: FY2024 net loss of $68.5M demonstrates downside when copper prices weaken or costs escalate.
- Working Capital Pressure: Quick ratio of 0.65 suggests potential short-term funding needs.
7. Capital Raising Activity
| Period | Activity | Details |
|---|---|---|
| Last 6 Months (Feb–Aug 2026) | No equity issuance | Company funded operations and capex from cash flow and existing debt facilities |
| Last 6 Months (Feb–Aug 2026) | Debt management | Continued servicing of existing debt; no new major facilities announced (estimate) |
| Next 6 Months (Aug 2026–Feb 2027) | Projected | Likely no equity dilution; potential refinancing of near-term maturities; FCF expected to fund remaining capex (estimate) |
Historical Context: The company raised equity in prior years to fund growth (share count increased from 92.2M in 2022 to 104.2M in 2025), primarily for the Tucumã development. With the project now operational, the equity dilution phase appears complete.
All figures sourced from Yahoo Finance data as of August 7, 2026. Items labeled as estimates are based on analyst judgment and industry knowledge where public data was unavailable.
Disclaimer: This report is for informational and educational purposes only and does not constitute investment advice. Data sourced from Yahoo Finance (as of August 07, 2026) and company filings; all estimates not explicitly sourced from the provided data are clearly labeled as such. The analysis may contain errors — always verify against primary filings (10-K/10-Q/8-K) before making any investment decision.
Discover more from CANSLIM Research
Subscribe to get the latest posts sent to your email.