 Andrew@CANSLIM RESEARCH
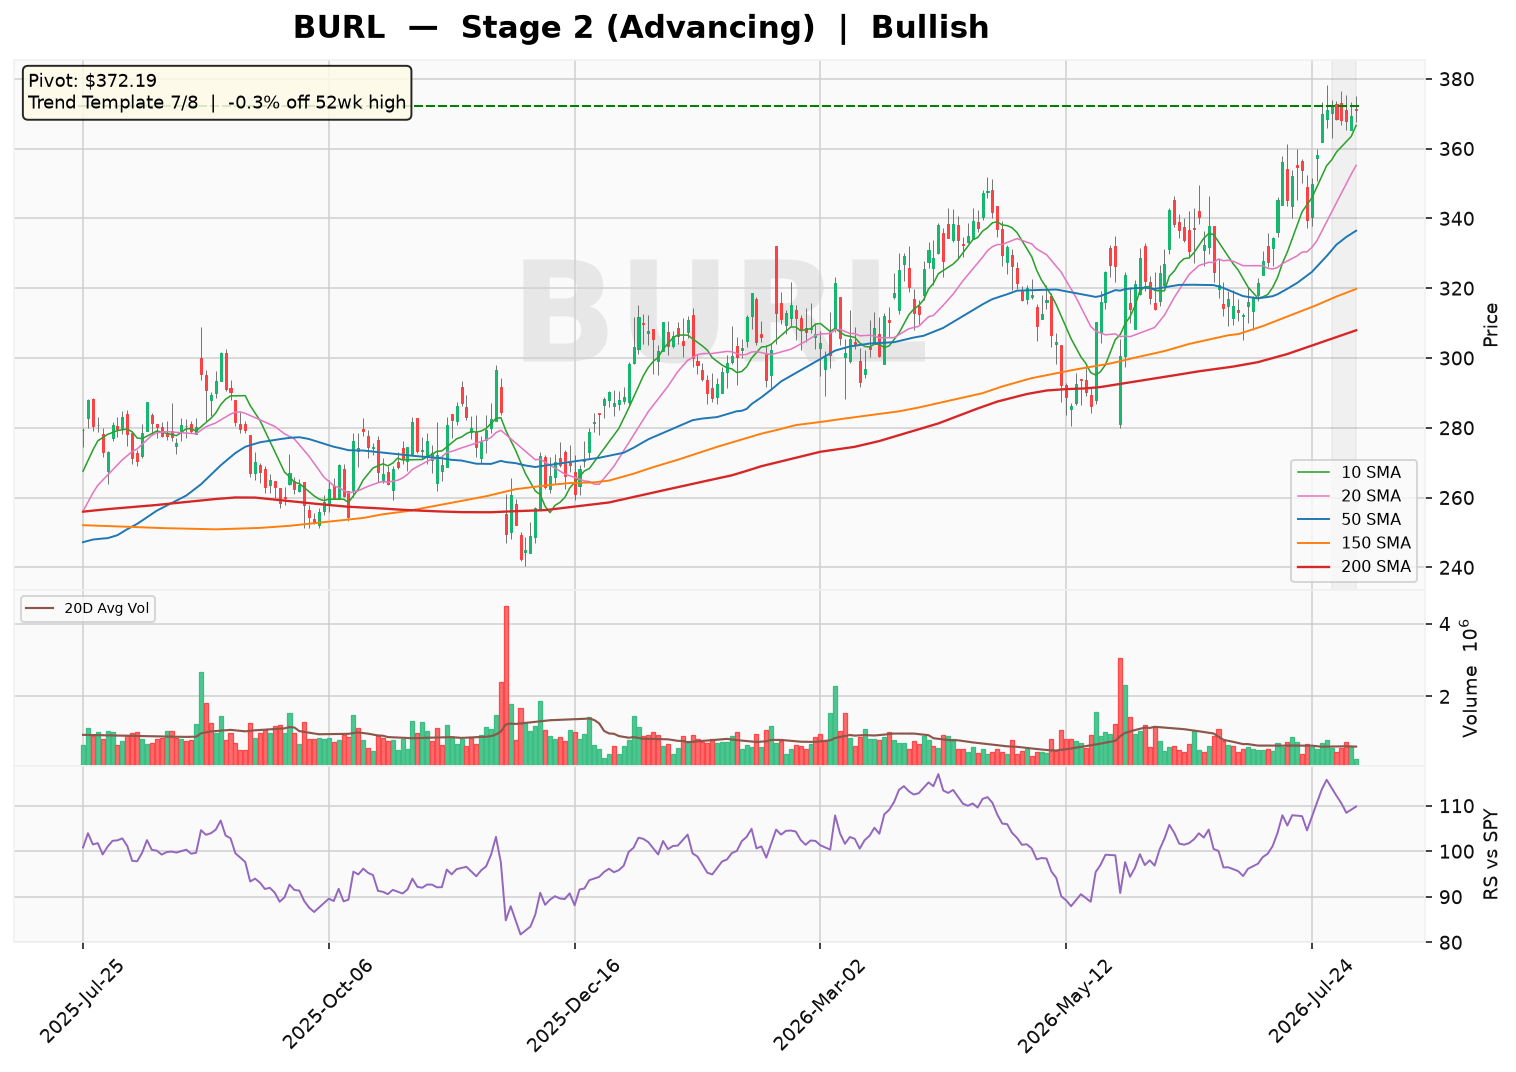
Burlington Stores (BURL) is trading in a strong Stage 2 uptrend, holding above a rising 30-week moving average with a 3.47% six-week slope. The stock is just 0.3% off its 52-week high, with a tight one-week base forming near the highs, suggesting a potential breakout above the 372.19 pivot.
The market is focused on the near-term consolidation at highs, as the stock has rallied 19.2% recently and is showing minimal pullback depth. With 7 of 8 trend template checks passing and a bullish sentiment score of 5, the setup is constructive, though the lack of a VCP and the RS line not at a three-month high warrant caution.
Technical Analysis
As of 2026-08-06 · Close $371.15
Stage Analysis
Stage 2 (Advancing) — Price holding above a rising 30-week MA — uptrend intact
(30-week MA 6-week slope: 3.47%)
Detected Patterns — What the Market Is Watching
- No actionable pattern detected at this time.
Minervini Trend Template — 7/8 Criteria Passed
| Criterion | Status |
|---|---|
| Price > 150MA & 200MA | ✅ Pass |
| 150MA > 200MA | ✅ Pass |
| 200MA trending up (>=1 month) | ✅ Pass |
| 50MA > 150MA & 200MA | ✅ Pass |
| Price > 50MA | ✅ Pass |
| Price >= 30% above 52wk low | ✅ Pass |
| Price within 25% of 52wk high | ✅ Pass |
| RS Line at/near 3-month high | ❌ Fail |
Price is -0.3% off its 52-week high and 53.1% above its 52-week low.
Pattern Sentiment
Bullish — offensive setup in place (composite score: 5)
Fundamental Snapshot
Burlington Stores, Inc. operates as a retailer of branded merchandise in the United States and Puerto Rico. The company offers fashion-focused merchandise, including women’s ready-to-wear apparel, menswear, youth apparel, footwear, accessories, home furnishings, toys, gifts, and coats, as well as baby and beauty merchandise products. It operates stores under the Burlington Stores, and Cohoes Fashions brands in Washington D.C. and Puerto Rico. The company was founded in 1972 and is headquartered in Burlington, New Jersey.
Market Cap: 23360999424 · Trailing P/E: 38.22348 · Forward P/E: 26.46459 · Revenue Growth: 0.141
Disclaimer: This report is for informational and educational purposes only and does not constitute investment advice. Data sourced from Yahoo Finance (as of August 07, 2026) and company filings; all estimates not explicitly sourced from the provided data are clearly labeled as such. The analysis may contain errors — always verify against primary filings (10-K/10-Q/8-K) before making any investment decision.
Discover more from CANSLIM Research
Subscribe to get the latest posts sent to your email.