 Eben@CANSLIM Research
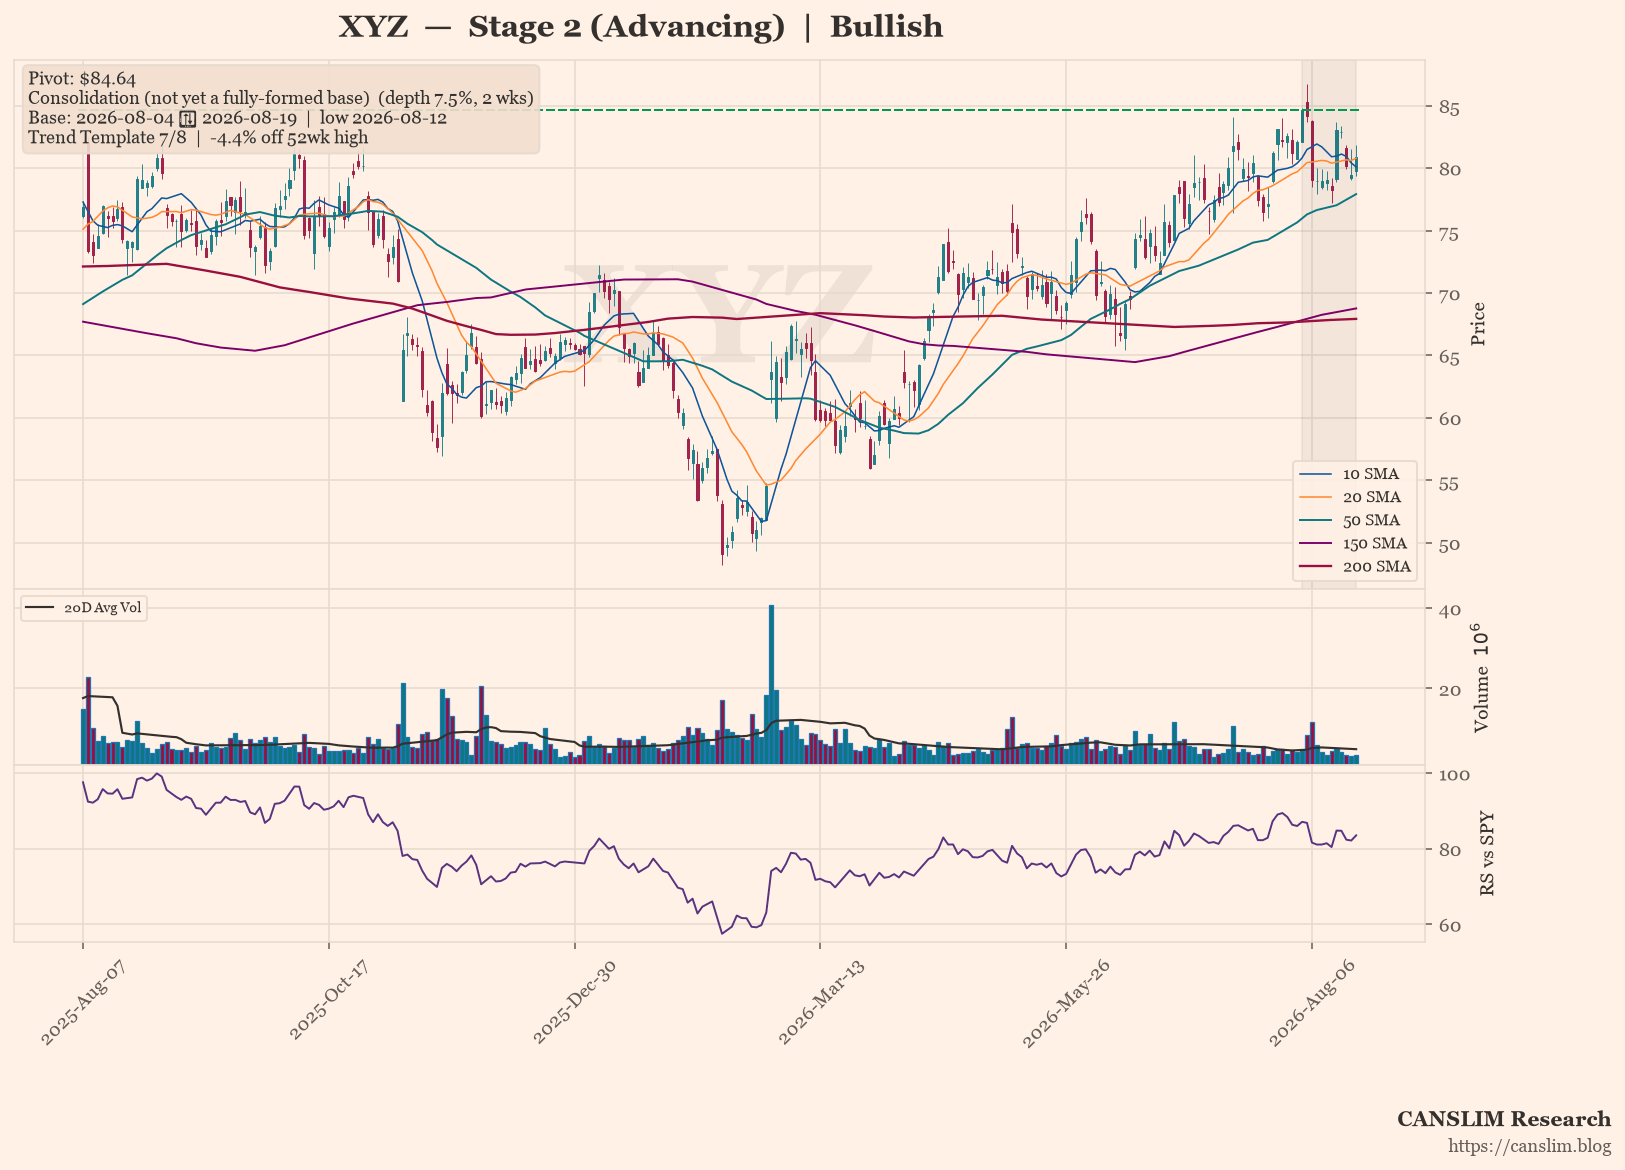
XYZ is trading in a Stage 2 uptrend, holding above a rising 30-week moving average with the 50-day, 150-day, and 200-day moving averages in bullish alignment. The stock is consolidating in a shallow 7.5% base just 4.4% off its 52-week high, with a pivot at 84.64. Market sentiment is bullish as the setup remains offensive, though the base is not yet fully formed and the relative strength line has not reached a three-month high.
Technical Analysis
As of 2026-08-19 · Close $80.93
Stage Analysis
Stage 2 (Advancing) — Price holding above a rising 30-week MA — uptrend intact (30-week MA 6-week slope: 3.36%)
Detected Patterns — What the Market Is Watching
- Consolidation (not yet a fully-formed base) — depth 7.5%, length 2 weeks, pivot $84.64

Subscribe to continue reading
Become a paid subscriber to get access to the rest of this post and other exclusive content.