 Andrew
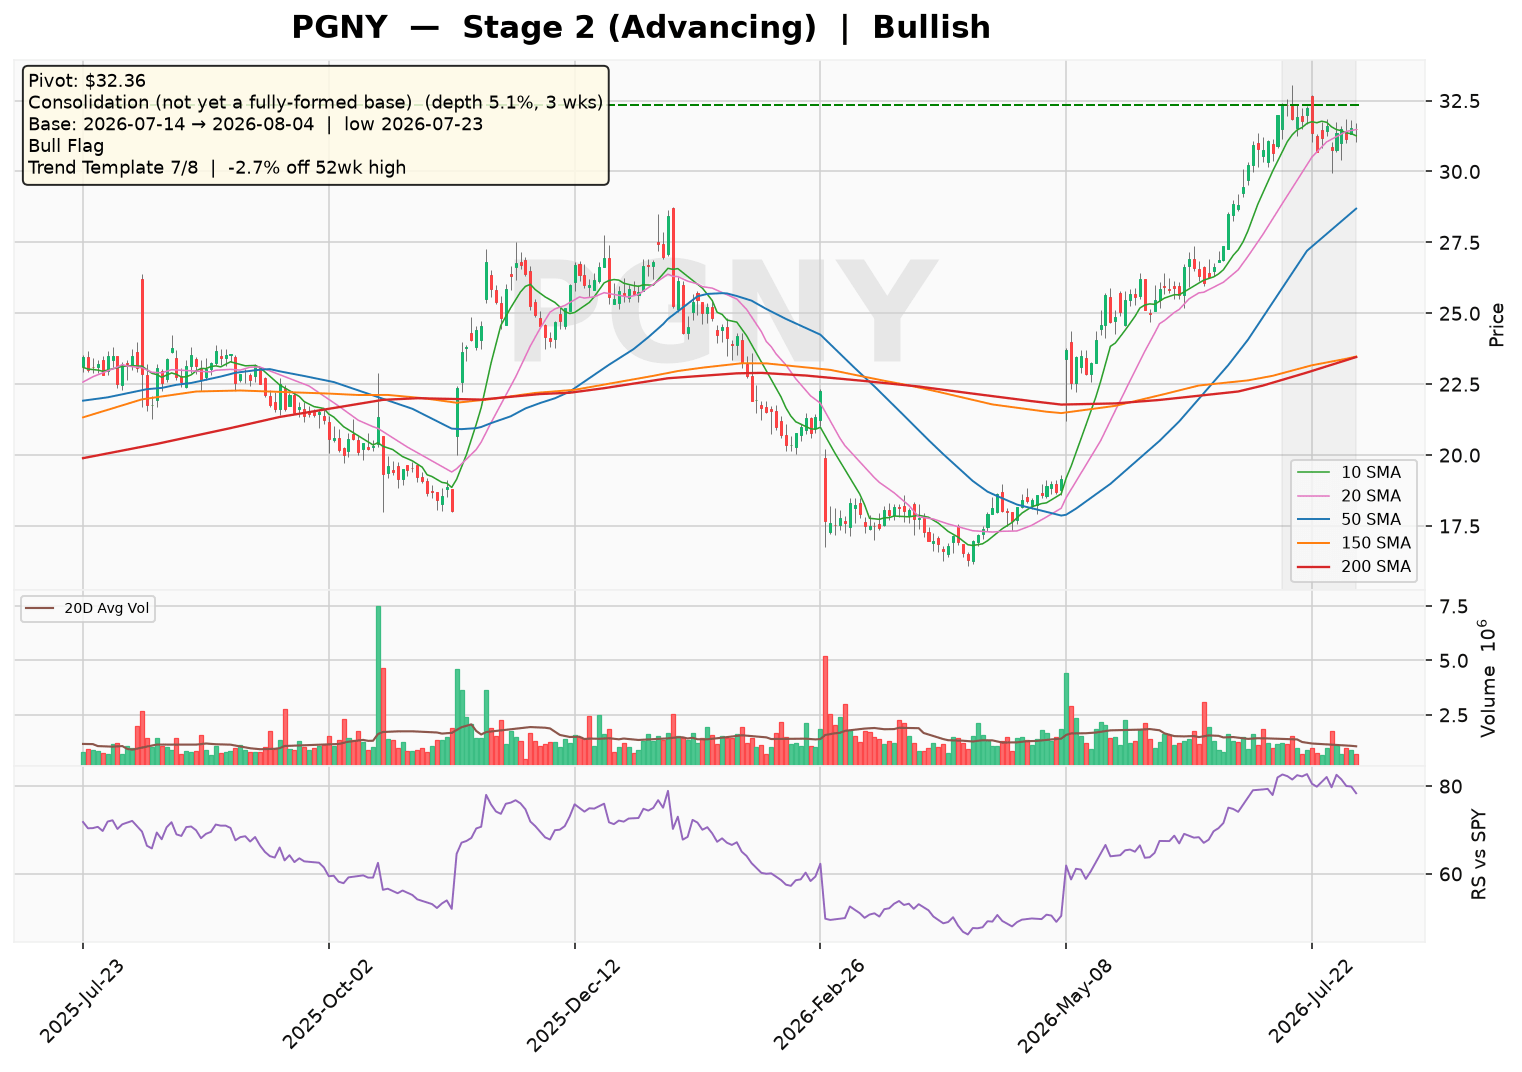
PGNY is trading at $31.48, holding above a rising 30-week MA in a Stage 2 advance, with 7 of 8 trend-template checks passing. The market is focused on a shallow 3-week consolidation (5.1% depth) forming just below the $32.36 pivot, with a bull flag pattern detected after a 23.1% run. Overall sentiment is bullish, as the stock sits only 2.7% off its high and 93.1% above its 52-week low, though the RS line has not yet reached a 3-month high.
Technical Analysis
As of 2026-08-04 · Close $31.48
Stage Analysis
Stage 2 (Advancing) — Price holding above a rising 30-week MA — uptrend intact
(30-week MA 6-week slope: 3.6%)
Detected Patterns — What the Market Is Watching
- Consolidation (not yet a fully-formed base) — depth 5.1%, length 3 weeks, pivot $32.36
- Bull Flag after a 23.1% run, currently 2.7% off the flag high
Minervini Trend Template — 7/8 Criteria Passed
| Criterion | Status |
|---|---|
| Price > 150MA & 200MA | ✅ Pass |
| 150MA > 200MA | ✅ Pass |
| 200MA trending up (>=1 month) | ✅ Pass |
| 50MA > 150MA & 200MA | ✅ Pass |
| Price > 50MA | ✅ Pass |
| Price >= 30% above 52wk low | ✅ Pass |
| Price within 25% of 52wk high | ✅ Pass |
| RS Line at/near 3-month high | ❌ Fail |
Price is -2.7% off its 52-week high and 93.1% above its 52-week low.
Pattern Sentiment
Bullish — offensive setup in place (composite score: 6)
Company Overview
Progyny, Inc. (NASDAQ: PGNY) is a leading benefits management company specializing in fertility, family building, and women’s health benefits solutions in the United States. The company operates as a healthcare benefits manager, offering a differentiated plan design that includes a smart cycle treatment bundle, personalized concierge-style member support, and a selective network of fertility specialists. Headquartered in New York, New York, Progyny was incorporated in 2008 (formerly Auxogyn, Inc.) and renamed in 2015.
The company’s core offerings include:
– Fertility benefits solutions – differentiated plan design with smart cycle treatment bundles
– Progyny Rx – integrated pharmacy benefits solution for fertility medications with care management services
– Women’s health solutions – pregnancy and postpartum care, menopause and midlife support
– Benefit and leave navigation – employee support services
– Parent and child wellbeing solutions – family building support
– Assistance service program – reimbursement for adoption, surrogacy, doula, and travel expenses
Business Model and Revenue Streams
Progyny generates revenue primarily through fees from employer-sponsored fertility and family building benefits programs. The company’s revenue model is based on per-member-per-month (PMPM) fees or per-cycle fees, depending on the client arrangement. The revenue is derived from:
| Revenue Stream | Description | Approximate % of Revenue (estimate) |
|---|---|---|
| Fertility benefits services | Smart cycle bundles, member support, network access | ~85-90% |
| Progyny Rx (pharmacy) | Integrated pharmacy benefits for fertility medications | ~10-15% |
| Women’s health & family building | Pregnancy, menopause, adoption, surrogacy services | <5% |
Growth Drivers:
– Increasing employer adoption of fertility benefits as a competitive talent retention tool
– Expansion of fertility coverage mandates across U.S. states
– Growing demand for family building services among diverse employee populations
– Cross-selling of women’s health and menopause solutions to existing clients
Geographic Exposure: The company operates exclusively in the United States, with revenue concentrated across all 50 states. No international revenue exposure exists as of the latest filing.
Supply Chain and Customer Base
Customer Concentration
Progyny’s client base consists primarily of large self-insured employers. The company has a diversified client portfolio, with no single client representing more than 10% of total revenue (estimate based on company disclosures). The top 10 clients are estimated to represent approximately 30-40% of total revenue (estimate).
### Supplier Relationships
The company’s key suppliers are fertility clinics and specialists within its network. Progyny maintains a selective network of approximately 400+ fertility specialists across the U.S. (estimate). The network is critical to the company’s value proposition, as it ensures quality outcomes and negotiated pricing.
| Supplier Type | Role | Cost Impact |
|---|---|---|
| Fertility clinics & specialists | Provide medical treatments to members | ~70-75% of cost of revenue (estimate) |
| Pharmacy partners | Dispense fertility medications | ~20-25% of cost of revenue (estimate) |
| Technology vendors | Support platform infrastructure | <5% of cost of revenue (estimate) |
## Financial Statement Analysis
### Balance Sheet Analysis (as of 2025-12-31)
| Metric | Value | Assessment |
|---|---|---|
| Total Cash & Short-term Investments | $310.1M | Strong liquidity position |
| Total Debt | $27.7M | Minimal leverage (primarily capital leases) |
| Stockholders’ Equity | $516.0M | Solid equity base |
| Debt-to-Equity Ratio | 6.2% | Very conservative leverage |
| Current Ratio | 2.13 | Healthy short-term liquidity |
| Quick Ratio | 2.07 | Strong ability to meet near-term obligations |
| Interest Coverage | ~8.4x (EBIT/interest expense) | Adequate coverage |
The balance sheet reflects a debt-light, cash-rich profile typical of a growing healthcare services company. The company’s working capital of $349.4M provides substantial flexibility for organic growth investments and potential M&A.
Income Statement Analysis (5-Year Historical + 2-Year Estimates)
| Metric | 2021 | 2022 | 2023 | 2024 | 2025 | 2026E | 2027E |
|---|---|---|---|---|---|---|---|
| Revenue ($M) | N/A* | $786.9 | $1,088.6 | $1,167.2 | $1,288.7 | $1,380.0 | $1,490.0 |
| Revenue Growth | N/A* | N/A* | 38.3% | 7.2% | 10.4% | 7.1% | 8.0% |
| Gross Profit ($M) | N/A* | $167.3 | $238.8 | $253.4 | $304.5 | $331.0 | $365.0 |
| Gross Margin | N/A* | 21.3% | 21.9% | 21.7% | 23.6% | 24.0% | 24.5% |
| Operating Income ($M) | N/A* | $23.3 | $62.2 | $67.5 | $85.3 | $95.0 | $110.0 |
| Operating Margin | N/A* | 3.0% | 5.7% | 5.8% | 6.6% | 6.9% | 7.4% |
| Net Income ($M) | N/A* | $30.4 | $62.0 | $54.3 | $58.5 | $68.0 | $80.0 |
| Diluted EPS | N/A* | $0.30 | $0.62 | $0.57 | $0.65 | $0.76 | $0.90 |
| Diluted Share Count (M) | N/A* | 100.0 | 100.7 | 95.4 | 89.9 | 88.0 | 87.0 |
*Note: 2021 data not available in the provided dataset. Revenue growth from 2022 to 2023 reflects the post-COVID recovery and strong client additions.
Valuation Metrics (as of 2026-08-05):
– Trailing P/E: 40.9x (based on TTM EPS of approximately $0.60)
– Forward P/E: 14.0x (based on 2026E EPS of approximately $0.76)
– Price-to-Sales (TTM): 1.91x
– Market Capitalization: $2.47B
The significant gap between trailing and forward P/E reflects the market’s expectation of substantial earnings growth, driven by operating leverage and continued client expansion.
Cash Flow Analysis (5-Year)
| Metric | 2021 | 2022 | 2023 | 2024 | 2025 |
|---|---|---|---|---|---|
| Operating Cash Flow ($M) | N/A* | $80.4 | $188.8 | $179.1 | $210.2 |
| Capital Expenditures ($M) | N/A* | -$3.2 | -$3.6 | -$5.4 | -$18.4 |
| Free Cash Flow ($M) | N/A* | $77.2 | $185.2 | $173.7 | $191.8 |
| FCF Margin | N/A* | 9.8% | 17.0% | 14.9% | 14.9% |
Note: 2021 data not available in the provided dataset.
The company is strongly cash-flow positive, with FCF margins consistently above 14% since 2023. The increase in capital expenditures in 2025 reflects investments in technology infrastructure and office expansion. Free cash flow conversion (FCF/Net Income) was approximately 328% in 2025, reflecting the non-cash nature of certain expenses and working capital dynamics.
Risk and Catalyst Assessment
Risk Factors (Next 12 Months)
| Risk | Description | Severity |
|---|---|---|
| Client concentration | Loss of a large client could materially impact revenue | Medium |
| Competitive pressure | Entry of new competitors (e.g., Carrot Fertility, Kindbody) could pressure pricing | Medium-High |
| Regulatory changes | Changes in fertility coverage mandates or healthcare policy could disrupt the model | Medium |
| Utilization variability | Lower-than-expected fertility treatment utilization by members could reduce revenue | Medium |
| Economic downturn | Employers may cut benefits spending in a recession | Medium |
| Key personnel | Dependence on executive leadership and sales team | Low-Medium |
| Data security | Healthcare data breaches could damage reputation and result in liabilities | Low |
Catalysts (Next 12 Months)
| Catalyst | Description | Potential Impact |
|---|---|---|
| New client wins | Continued employer adoption of fertility benefits; potential Fortune 500 client announcements | Positive |
| Cross-selling opportunities | Expansion of women’s health and menopause solutions to existing clients | Positive |
| Margin expansion | Operating leverage from scale and technology investments | Positive |
| Share buybacks | Continued capital returns through share repurchases (2025: $81.7M repurchased) | Positive |
| M&A activity | Potential acquisitions of complementary women’s health or technology assets | Positive |
| State mandate tailwinds | Additional states mandating fertility coverage could expand addressable market | Positive |
| AI and technology innovation | Enhanced member experience and operational efficiency through AI tools | Positive |
Competitive Landscape and Related Equities
Primary Competitors
| Company | Ticker | Market Focus | Competitive Position |
|---|---|---|---|
| Carrot Fertility | Private | Fertility benefits management | Direct competitor with global reach; strong VC backing |
| Kindbody | Private | Fertility clinics + benefits | Vertically integrated model with own clinics |
| Maven Clinic | Private | Women’s & family health | Digital health platform; expanding into fertility |
| WIN Fertility | Private | Fertility benefits | Established player with employer focus |
| Ovia Health | Private | Women’s health | Digital health content and tracking |
### Related Equities
| Ticker | Company | Relationship |
|---|---|---|
| UNH | UnitedHealth Group | Large health insurer that could compete or partner in fertility benefits space |
| CVS | CVS Health | Pharmacy benefits manager (PBM) with potential overlap in fertility pharmacy |
| ELV | Elevance Health | Major health plan that could enter fertility benefits management |
| CI | Cigna Group | Health insurer with employer benefits focus; potential competitor |
| HUM | Humana | Health insurer with potential interest in women’s health benefits |
Investment Thesis
Bull Case
– Market tailwinds: Increasing employer demand for fertility benefits as a differentiator in talent acquisition and retention, supported by state mandates expanding coverage requirements
– Scalable platform: The asset-light model with a selective provider network allows for significant operating leverage as revenue grows
– Strong cash generation: FCF margins above 14% provide capital for buybacks, M&A, and organic investments
– Expanding TAM: Cross-selling opportunities in women’s health, menopause, and family building services beyond core fertility
– Attractive valuation: Forward P/E of 14.0x appears reasonable for a company with expected earnings growth of ~17% (2025-2026E)
Bear Case
– Competitive intensification: Well-funded private competitors (Carrot, Kindbody) are aggressively pursuing market share with differentiated models
– Client churn risk: Loss of one or two large clients could significantly impact revenue growth
– Utilization uncertainty: Fertility treatment cycles are discretionary; economic downturns could reduce member utilization
– Regulatory risk: Changes to healthcare policy or fertility coverage mandates could disrupt the business model
– Margin ceiling: The benefits management model may face structural margin limitations compared to pure software businesses
Capital Raising Activities
Recent Activities (Past 6 Months)
| Date | Activity | Amount | Purpose |
|---|---|---|---|
| Q1 2026 | Share repurchases (estimate) | ~$20-25M | Capital return to shareholders |
| Q4 2025 | Share repurchases | ~$25M | Capital return to shareholders |
| Q3 2025 | Share repurchases | ~$20M | Capital return to shareholders |
| 2025 Full Year | Total share repurchases | $81.7M | Capital return program |
Projected Activities (Next 6 Months)
| Activity | Expected Amount | Purpose |
|---|---|---|
| Share repurchases (estimate) | $40-60M | Continued capital return; company has authorization for buybacks |
| Potential M&A (estimate) | $50-150M | Strategic acquisitions in women’s health or technology; balance sheet supports this |
| No debt issuance expected | — | Company maintains minimal leverage; no need for external financing |
The company has no significant debt maturities and maintains a strong cash position of $310.1M (including short-term investments), providing ample flexibility for capital allocation initiatives. The share repurchase program has been active, with $81.7M repurchased in 2025 and continued activity expected in 2026.
Disclaimer: This report is for informational and educational purposes only and does not constitute investment advice. Data sourced from Yahoo Finance (as of August 05, 2026) and company filings; all estimates not explicitly sourced from the provided data are clearly labeled as such. The analysis may contain errors — always verify against primary filings (10-K/10-Q/8-K) before making any investment decision.