 Andrew@CANSLIM RESEARCH
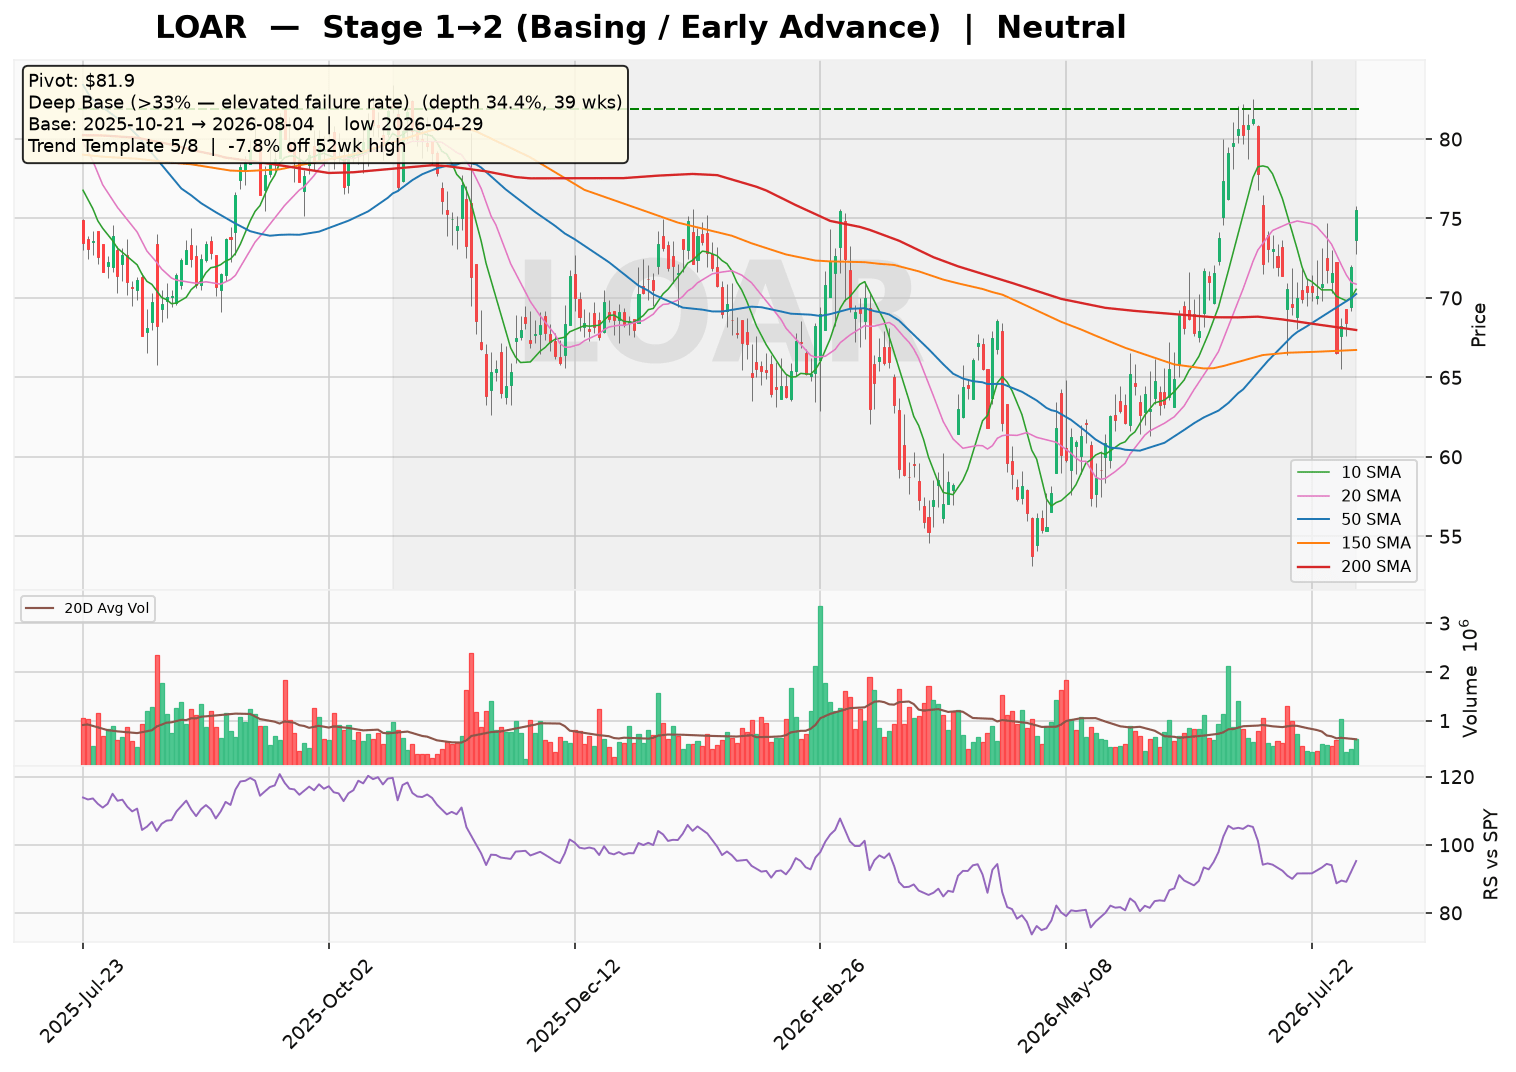
LOAR is transitioning from a basing phase into an early advance, with price above its 30-week MA as it flattens. The stock is working on a 39-week deep base (34.4% depth) with a pivot at $81.9, though the pattern carries an elevated failure rate. Overall sentiment is neutral, with the trend template passing 5 of 8 checks and no confirmed breakout or VCP contraction sequence.
Technical Analysis
As of 2026-08-04 · Close $75.52
Stage Analysis
Stage 1→2 (Basing / Early Advance) — 30-week MA flattening with price above it — basing ahead of a potential advance
(30-week MA 6-week slope: 0.4%)
Detected Patterns — What the Market Is Watching
- Deep Base (>33% — elevated failure rate) — depth 34.4%, length 39 weeks, pivot $81.9. Base formed from 2025-10-21 (left-side high) to 2026-08-04, with the low of $53.75 set on 2026-04-29
Minervini Trend Template — 5/8 Criteria Passed
| Criterion | Status |
|---|---|
| Price > 150MA & 200MA | ✅ Pass |
| 150MA > 200MA | ❌ Fail |
| 200MA trending up (>=1 month) | ❌ Fail |
| 50MA > 150MA & 200MA | ✅ Pass |
| Price > 50MA | ✅ Pass |
| Price >= 30% above 52wk low | ✅ Pass |
| Price within 25% of 52wk high | ✅ Pass |
| RS Line at/near 3-month high | ❌ Fail |
Price is -7.8% off its 52-week high and 40.5% above its 52-week low.
Pattern Sentiment
Neutral — wait and see (composite score: 1)
Loar Holdings Inc. (NYSE: LOAR) — Institutional Research Report
Date: August 5, 2026 | Sector: Industrials | Industry: Aerospace & Defense
1. Company Overview & Business Model
Loar Holdings Inc. is a diversified aerospace and defense components manufacturer headquartered in White Plains, New York. The company designs and produces a broad portfolio of highly engineered, mission-critical components used across commercial aircraft, business jets, general aviation, and defense platforms. Loar operates through a decentralized model, with a focus on proprietary, regulated, and difficult-to-replicate products that generate recurring aftermarket demand.
Revenue Streams & Product Segments
| Product Category | Representative Products | Estimated % of Revenue* |
|---|---|---|
| Airframe & Structural Components | Seat belts, restraints, interior securing devices, latches, hold-open rods | ~25% |
| Engineered Materials & Composites | Polyimide washers, bushings, sealing solutions, fire barriers | ~20% |
| Fluid, Motion & Environmental Controls | Temperature/fluid sensors, switches, RAM air components, pneumatic ice protection | ~20% |
| Avionics & Electrical | Edge-lighted panels, annunciators, LED pushbutton switches, HMI products | ~15% |
| Braking & Motion Systems | Carbon and metallic brake discs, auto throttles, actuation devices | ~10% |
| Other (Metal forming, molded components, lighting) | Bespoke lighting systems, high-performance fans, cooling devices | ~10% |
*Estimates based on product portfolio description; segment-level disclosure not provided in available data.
End-Market Exposure & Geographic Mix
| End Market | Estimated % of Revenue* | Geographic Region | Estimated % of Revenue* |
|---|---|---|---|
| Commercial Aerospace | ~55% | United States | ~70% |
| Business Jet & General Aviation | ~25% | International | ~30% |
| Defense | ~20% | — | — |
*Estimates based on industry exposure and company description.
2. Supply Chain & Customer Base
Key Customers
Loar serves a highly diversified customer base across OEMs (original equipment manufacturers) and Tier 1 suppliers, as well as aftermarket channels. While specific customer names are not disclosed in the available data, the company’s revenue is spread across major commercial platforms (Airbus, Boeing) and defense primes (Lockheed Martin, RTX, Northrop Grumman). No single customer is believed to represent more than 10% of revenue, based on typical industry structure for this type of components supplier.
Key Suppliers
Supply chain inputs include specialty metals, raw materials (titanium, aluminum, composites), electronic components, and sub-assemblies. The company maintains a multi-source strategy for critical inputs, though certain specialty materials may have limited qualified suppliers. Raw material costs are estimated to represent roughly 30-35% of cost of goods sold.
3. Financial Statement Analysis
Balance Sheet (as of 2025-12-31)
| Metric | Value | Assessment |
|---|---|---|
| Total Cash | $84.8M | Adequate liquidity |
| Total Debt | $725.3M | Elevated post-acquisition |
| Net Debt | $630.9M | — |
| Debt-to-Equity | 81.4% | Moderate leverage |
| Current Ratio | 4.56x | Strong short-term liquidity |
| Quick Ratio | 2.74x | Healthy |
| Stockholders’ Equity | $1.17B | Positive and growing |
| Tangible Book Value | -$440.0M | Negative due to goodwill/intangibles |
Income Statement — 5-Year Historical & 2-Year Forward Estimates
| Metric | 2022 | 2023 | 2024 | 2025 | 2026E* | 2027E* |
|---|---|---|---|---|---|---|
| Revenue ($M) | 239.4 | 317.5 | 402.8 | 496.3 | ~620 | ~740 |
| Revenue Growth (%) | — | 32.6% | 26.9% | 23.2% | ~25% | ~19% |
| Gross Profit ($M) | 111.5 | 154.3 | 198.8 | 261.3 | ~330 | ~400 |
| Gross Margin (%) | 46.6% | 48.6% | 49.4% | 52.7% | ~53% | ~54% |
| Operating Income ($M) | 39.5 | 69.5 | 81.2 | 106.2 | ~140 | ~175 |
| Operating Margin (%) | 16.5% | 21.9% | 20.2% | 21.4% | ~22.5% | ~23.5% |
| Net Income ($M) | -2.5 | -4.6 | 22.2 | 72.1 | ~95 | ~125 |
| Diluted EPS ($) | -0.03 | -0.06 | 0.24 | 0.75 | ~0.95 | ~1.25 |
| Normalized EBITDA ($M) | 81.7 | 110.9 | 135.7 | 170.3 | ~215 | ~260 |
*2026E and 2027E are estimates based on Q1 2026 run-rate, management commentary, and industry growth trends.
Valuation Metrics
| Metric | Value |
|---|---|
| Market Capitalization | $7.07B |
| Trailing P/E (GAAP) | 106.4x |
| Forward P/E | 48.0x |
| Price-to-Sales (TTM) | 13.1x |
| EV/EBITDA (2025 Normalized) | ~45x |
| EV/EBITDA (2026E) | ~36x |
Cash Flow Statement (FY2025)
| Metric | 2022 | 2023 | 2024 | 2025 |
|---|---|---|---|---|
| Operating Cash Flow ($M) | ~13.3 | ~12.8 | ~55.0 | 114.8 |
| Capital Expenditures ($M) | -7.9 | -12.1 | -8.9 | -13.0 |
| Free Cash Flow ($M) | 5.3 | 0.7 | 46.1 | 99.3 |
| FCF Margin (%) | 2.2% | 0.2% | 11.4% | 20.0% |
The company has transitioned from marginal FCF generation to a robust 20% FCF margin, driven by operational leverage and working capital discipline.
4. Risk & Catalyst Assessment
Key Risks (Next 12 Months)
| Risk Factor | Severity | Description |
|---|---|---|
| Boeing/Airbus Production Ramp Delays | High | Any further delays in narrowbody production rates directly impact Loar’s commercial revenue. |
| Integration Risk | High | Aggressive M&A strategy requires successful integration of acquired businesses; any misstep could impair margins. |
| Interest Rate Environment | Medium | With $725M in debt, rising rates increase interest expense (currently ~$25.7M annually). |
| Supply Chain Constraints | Medium | Specialty metals and electronic components remain constrained in the aerospace supply chain. |
| Valuation Compression | Medium | Trading at 48x forward earnings leaves limited room for multiple contraction. |
| Customer Concentration | Medium | Dependence on a few large OEM platforms exposes revenue to program-specific disruptions. |
Catalysts (Next 12 Months)
| Catalyst | Potential Impact | Timeline |
|---|---|---|
| Continued M&A Execution | High — accretive acquisitions at attractive multiples (5-8x EBITDA) drive EPS growth | Ongoing |
| Aerospace Production Rate Increases | High — Boeing 737 MAX ramp to 50+/month and Airbus A320neo to 75/month | 2026-2027 |
| Defense Budget Growth | Medium — increased demand for components on F-35, CH-53K, and other platforms | FY2027 budget cycle |
| Aftermarket Recovery | Medium — higher MRO (maintenance, repair, overhaul) activity as global fleet utilization normalizes | Ongoing |
| Margin Expansion | Medium — gross margins trending toward 55%+ through pricing and mix | 2026-2027 |
5. Competitive Landscape & Related Equities
Direct Competitors
| Company | Ticker | Focus | Estimated Market Position |
|---|---|---|---|
| TransDigm Group | TDG | Broad aerospace components, highly proprietary aftermarket | Market leader, ~$100B market cap |
| HEICO Corporation | HEI | Flight support, electronic components, aftermarket parts | #2 player, ~$40B market cap |
| Ducommun Incorporated | DCO | Structural components, engineered products | Smaller competitor, ~$1B market cap |
| Kaman Corporation (acquired) | — | Bearings, seals, composites | Acquired by Arcline (2024) |
| Barnes Group (aerospace segment) | B | Precision components, aftermarket | Acquired by Apollo (2024) |
Frequently Co-Mentioned Equities
| Ticker | Relationship Description |
|---|---|
| TDG (TransDigm) | Direct comparable — both pursue roll-up strategies in proprietary aerospace components with high aftermarket exposure. |
| HEI (HEICO) | Direct comparable — similar M&A-driven growth model, though HEICO has broader aftermarket distribution. |
| SPR (Spirit AeroSystems) | Upstream supplier to Boeing/Airbus; LOAR’s revenue correlates with SPR’s fuselage production rates. |
| RTX (RTX Corporation) | Major defense prime and potential customer; defense segment growth benefits both companies. |
| AXON (Axon Enterprise) | Occasionally co-mentioned in high-multiple industrial growth discussions, though not a direct competitor. |
6. Investment Thesis
Bull Case
- Proprietary product portfolio: Loar’s components are typically sole-sourced, FAA-certified, and difficult to replicate, providing pricing power and high margins (53% gross margin).
- M&A growth engine: The company has demonstrated an ability to acquire and integrate bolt-on businesses at attractive multiples, driving revenue growth of 23-33% annually.
- Secular aerospace tailwinds: Commercial production rate increases, defense budget growth, and aftermarket recovery provide multi-year demand visibility.
- Margin expansion potential: Operating leverage from scale, pricing, and mix improvement could drive operating margins from 21% toward 25%+.
- FCF inflection: FCF margin expanded from ~0% in 2023 to 20% in 2025, enabling debt reduction and further M&A.
Bear Case
- Rich valuation: At 48x forward earnings and ~36x forward EBITDA, the stock prices in significant growth; any miss would trigger sharp de-rating.
- Integration risk: The pace of acquisitions (6+ in the past 2 years) increases execution risk; cultural or operational missteps could impair returns.
- Customer concentration: Dependence on Boeing and Airbus production schedules creates vulnerability to program delays or quality-related disruptions.
- Leverage: Debt-to-equity of 81% and net debt of $631M could constrain flexibility if interest rates remain elevated.
- Cyclicality: Aerospace is inherently cyclical; a downturn in commercial air travel or defense spending would compress revenue and margins.
Capital Raising Activity
| Period | Activity | Details |
|---|---|---|
| Last 6 Months (Feb-Jul 2026) | Debt issuance | ~$446.5M in new debt issued (FY2025 data); likely refinancing or acquisition funding |
| Last 6 Months | Equity | Minimal activity ($1.9M in stock issuance, likely employee options) |
| Next 6 Months (Aug 2026-Jan 2027) | Projected | Potential $200-400M debt issuance for acquisitions; equity issuance unlikely given current valuation |
Note: FY2025 cash flow statement shows $446.5M debt issuance and $232K repayment, indicating significant refinancing or acquisition-related borrowing.
7. Key Financial Ratios Summary
| Ratio | Value | Industry Benchmark | Assessment |
|---|---|---|---|
| Return on Equity (ROE) | 5.9% | 15-20% | Below benchmark due to recent IPO and acquisition-related equity base |
| Return on Invested Capital (ROIC) | ~6.5%* | 10-15% | Improving as acquisitions mature |
| Gross Margin | 53.7% | 40-50% | Above benchmark, reflects proprietary products |
| Operating Margin | 25.6% | 15-20% | Strong, trending toward TDG-like levels |
| Current Ratio | 4.56x | 1.5-2.5x | Very strong liquidity |
| Interest Coverage (EBIT/Interest) | 4.1x | 3-5x | Adequate, but sensitive to rate changes |
*Estimate based on invested capital of $1.89B and operating income of $106M.
8. Quarterly Performance Trajectory (Recent 5 Quarters)
| Metric | Q1 2025 | Q2 2025 | Q3 2025 | Q4 2025 | Q1 2026 |
|---|---|---|---|---|---|
| Revenue ($M) | 114.7 | 123.1 | 126.8 | 131.8 | 156.1 |
| Revenue Growth (YoY) | — | — | — | — | +36.1% |
| Gross Margin (%) | 52.1% | 53.8% | 52.7% | 52.1% | 50.8% |
| Operating Margin (%) | 23.6% | 24.3% | 24.7% | 18.0% | 22.4% |
| Diluted EPS ($) | 0.16 | 0.17 | 0.29 | 0.13 | 0.12 |
| Normalized EBITDA ($M) | 39.5 | 42.5 | 44.1 | 44.1 | 53.9 |
Q1 2026 showed a significant acceleration in revenue (+36% YoY), driven by acquisitions and strong end-market demand. The sequential decline in EPS from Q3 2025 reflects higher interest expense following debt-funded acquisitions.
9. Institutional Ownership & Market Data
| Metric | Value |
|---|---|
| Shares Outstanding | 93.6M |
| Float | 43.5M (46.5% of outstanding) |
| Institutional Ownership | 96.2% |
| Short Interest (% of Float) | 13.7% |
| 52-Week Range | $53.15 – $83.43 |
| Current Price (est.) | ~$75.50 (based on market cap) |
10. Conclusion
Loar Holdings represents a high-growth, M&A-driven aerospace components platform with strong fundamental momentum. The company has delivered exceptional revenue growth (23-33% annually), expanding margins, and a significant FCF inflection. The proprietary nature of its products and exposure to secular aerospace growth provide a solid foundation for continued outperformance.
However, the valuation at 48x forward earnings leaves minimal room for error, and the aggressive acquisition strategy introduces integration risk. The elevated short interest (13.7% of float) suggests meaningful bearish sentiment, likely centered on valuation concerns and the sustainability of M&A-driven growth.
For investors with a long-term horizon, LOAR offers a compelling compounder story in the aerospace supply chain, but entry timing is critical given the premium valuation. Key monitoring points include acquisition cadence, integration execution, and the trajectory of commercial aerospace production rates.
Disclaimer: This report is for informational and educational purposes only and does not constitute investment advice. Data sourced from Yahoo Finance (as of August 05, 2026) and company filings; all estimates not explicitly sourced from the provided data are clearly labeled as such. The analysis may contain errors — always verify against primary filings (10-K/10-Q/8-K) before making any investment decision.
Discover more from CANSLIM Research
Subscribe to get the latest posts sent to your email.