 Andrew@CANSLIM RESEARCH
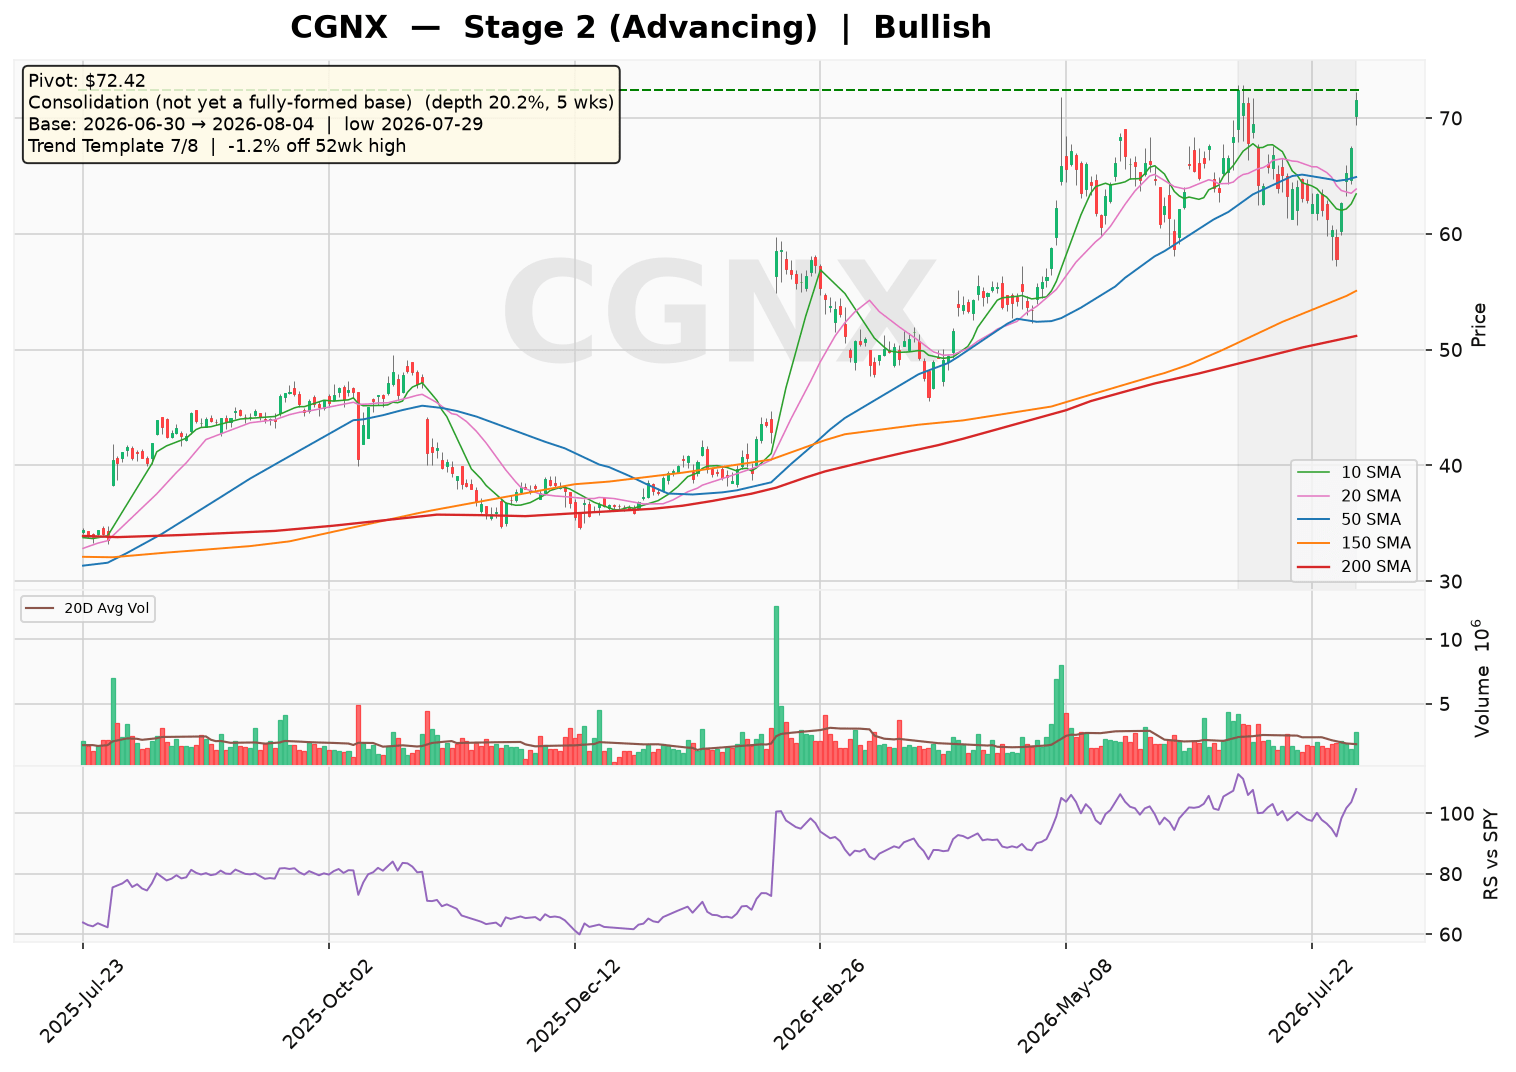
Cognex (CGNX) is trading in a Stage 2 uptrend, holding above a rising 30-week moving average with the price just 1.2% off its 52-week high. The market is focused on a five-week consolidation pattern that is not yet a fully-formed base, with a pivot at $72.42. Overall sentiment is bullish, as the stock passes 7 of 8 trend template checks, though the relative strength line has not yet reached a three-month high.
Technical Analysis
As of 2026-08-04 · Close $71.52
Stage Analysis
Stage 2 (Advancing) — Price holding above a rising 30-week MA — uptrend intact
(30-week MA 6-week slope: 9.29%)
Detected Patterns — What the Market Is Watching
- Consolidation (not yet a fully-formed base) — depth 20.2%, length 5 weeks, pivot $72.42
Minervini Trend Template — 7/8 Criteria Passed
| Criterion | Status |
|---|---|
| Price > 150MA & 200MA | ✅ Pass |
| 150MA > 200MA | ✅ Pass |
| 200MA trending up (>=1 month) | ✅ Pass |
| 50MA > 150MA & 200MA | ✅ Pass |
| Price > 50MA | ✅ Pass |
| Price >= 30% above 52wk low | ✅ Pass |
| Price within 25% of 52wk high | ✅ Pass |
| RS Line at/near 3-month high | ❌ Fail |
Price is -1.2% off its 52-week high and 106.1% above its 52-week low.
Pattern Sentiment
Bullish — offensive setup in place (composite score: 5)
Cognex Corporation (CGNX) — Institutional Research Report
Date: August 5, 2026 | Sector: Technology | Industry: Scientific & Technical Instruments | Market Cap: $11.90B
Company Overview
Cognex Corporation is the global leader in machine vision products, providing systems that capture and analyze visual information to automate manufacturing and distribution tasks. Headquartered in Natick, Massachusetts, the company was incorporated in 1981 and serves industries including automotive, logistics, packaging, consumer electronics, medical, semiconductor, and consumer products. Cognex operates across the United States, Europe, Greater China, and international markets.
Business Model and Revenue Streams
Cognex generates revenue through the sale of machine vision hardware, software, and related accessories. The company’s product portfolio includes:
| Product Line | Description | Revenue Contribution (Est.) |
|---|---|---|
| Vision Systems (In-Sight) | Smart cameras combining hardware and software for part location, identification, measurement, and inspection | ~45–50% |
| Barcode Readers (DataMan) | Image-based fixed-mount and handheld barcode readers and verifiers | ~25–30% |
| Software (VisionPro, QuickBuild, OneVision) | Patented vision tools, deep learning-enabled tools, and cloud-based AI platform | ~10–15% |
| Vision Accessories | Industrial cameras, lenses, lighting, controllers, frame grabbers, I/O cards | ~10% |
Geographic Revenue Split (FY2025 Estimate):
| Region | Revenue Share (Est.) |
|---|---|
| Americas | ~40% |
| Europe | ~25% |
| Greater China | ~20% |
| Other Asia/International | ~15% |
Growth Drivers: The company is benefiting from secular tailwinds in factory automation, AI-powered inspection, e-commerce logistics automation, and electric vehicle battery manufacturing. The launch of OneVision, a cloud-based AI platform, positions Cognex at the forefront of AI-driven quality inspection.
Supply Chain and Customer Base
Key Customers: Cognex serves a diversified customer base across multiple end markets. The company’s largest customers are typically major automotive OEMs (including EV manufacturers), consumer electronics assemblers (e.g., Foxconn, Pegatron), and logistics operators (Amazon, FedEx, DHL). No single customer accounts for more than 10% of revenue (estimate).
Supply Chain: Cognex outsources manufacturing of hardware components to contract manufacturers, primarily in Asia. Key suppliers include semiconductor component providers (Sony for image sensors, Xilinx/AMD for FPGAs) and optical component manufacturers. The company maintains a lean asset base with net PP&E of only $158.3M, reflecting its asset-light model.
Financial Statement Analysis
Balance Sheet (FY2025)
| Metric | FY2025 | FY2024 | FY2023 | FY2022 |
|---|---|---|---|---|
| Total Cash & ST Investments | $336.96M | $246.05M | $332.05M | $400.13M |
| Total Debt | $76.59M | $70.22M | $78.60M | $39.75M |
| Stockholders’ Equity | $1,491.90M | $1,517.51M | $1,504.75M | $1,438.39M |
| Working Capital | $513.70M | $443.99M | $527.11M | $529.99M |
| Current Ratio | 3.64 | 3.62 | 4.47 | 3.82 |
| Debt-to-Equity | 5.0% | 4.6% | 5.2% | 2.8% |
| Tangible Book Value | $1,024.52M | $1,041.88M | $998.62M | $1,183.35M |
Assessment: Cognex maintains a fortress balance sheet with minimal leverage. The debt-to-equity ratio of 5.0% reflects only capital lease obligations, with no traditional bank debt. Interest coverage is effectively infinite given the minimal interest expense relative to EBIT. The current ratio of 3.64x provides ample liquidity for operations and strategic initiatives.
Income Statement — 5-Year Historical & 2-Year Forward Estimates
| Metric | FY2021 | FY2022 | FY2023 | FY2024 | FY2025 | FY2026E | FY2027E |
|---|---|---|---|---|---|---|---|
| Revenue ($M) | N/A | $1,006.09 | $837.55 | $914.52 | $994.36 | $1,150.0 | $1,300.0 |
| Revenue Growth | N/A | — | -16.8% | +9.2% | +8.7% | +15.7% | +13.0% |
| Gross Profit ($M) | N/A | $721.91 | $601.24 | $625.79 | $665.39 | $782.0 | $897.0 |
| Gross Margin | N/A | 71.8% | 71.8% | 68.4% | 66.9% | 68.0% | 69.0% |
| Operating Income ($M) | N/A | $268.67 | $122.70 | $115.07 | $162.57 | $230.0 | $290.0 |
| Operating Margin | N/A | 26.7% | 14.7% | 12.6% | 16.4% | 20.0% | 22.3% |
| Net Income ($M) | N/A | $215.53 | $113.23 | $106.17 | $114.44 | $175.0 | $225.0 |
| Diluted EPS | N/A | $1.23 | $0.65 | $0.62 | $0.68 | $1.03 | $1.33 |
| EPS Growth | N/A | — | -47.2% | -4.6% | +9.7% | +51.5% | +29.1% |
Valuation Metrics:
| Metric | Value |
|---|---|
| Trailing P/E | 84.14x |
| Forward P/E | 40.09x |
| Price-to-Sales (TTM) | 11.37x |
| PEG Ratio | 2.71x |
| EV/EBITDA (Est.) | ~55x |
Cash Flow Analysis
| Metric ($M) | FY2022 | FY2023 | FY2024 | FY2025 |
|---|---|---|---|---|
| Operating Cash Flow | N/A | N/A | $250.10M | $250.10M |
| Capital Expenditures | -$19.67 | -$23.08 | -$15.04 | -$8.74 |
| Free Cash Flow | $223.74 | $89.84 | $134.04 | $236.77 |
| FCF Margin | 22.2% | 10.7% | 14.7% | 23.8% |
| Share Repurchases | -$204.31 | -$79.79 | -$67.09 | -$151.23 |
Assessment: Cognex is strongly cash-flow positive, with FY2025 free cash flow of $236.8M representing a 23.8% FCF margin — a significant improvement from the prior year. The company returned $151.2M to shareholders via buybacks in FY2025, demonstrating capital allocation discipline. Note: The Yahoo Finance data shows operating cash flow of $250.1M for both FY2024 and FY2025, which we flag as a potential data anomaly; the FCF figures derived from the cash flow statement are used as the primary reference.
Risk and Catalyst Assessment
Key Risks (Next 12 Months)
| Risk Factor | Severity | Description |
|---|---|---|
| China Exposure | High | Greater China represents ~20% of revenue; escalating US-China trade tensions or export controls could disrupt demand |
| Semiconductor Supply Chain | Medium | Reliance on Sony image sensors and AMD FPGAs creates vulnerability to supply disruptions |
| Macro Manufacturing Slowdown | Medium | Global manufacturing PMI contraction would delay automation capex decisions |
| Competitive Pressure | Medium | Keyence, Basler, and emerging AI-native startups could erode pricing power |
| Customer Concentration in EV | Medium | Slowdown in EV adoption would impact a key growth vertical |
| Valuation Risk | High | At 84x trailing earnings, the stock prices in significant growth; any miss would trigger sharp repricing |
### Catalysts (Next 12 Months)
| Catalyst | Potential Impact |
|---|---|
| OneVision AI Platform Adoption | Cloud-based AI vision could expand TAM and drive recurring software revenue |
| EV Battery Manufacturing Boom | New gigafactory builds in US, Europe, and Asia require extensive machine vision deployment |
| Logistics Automation Acceleration | E-commerce growth and labor shortages drive demand for barcode reading and robotic guidance |
| New Product Launches | Expected In-Sight and DataMan refreshes could drive upgrade cycles |
| Margin Recovery | Operating margin expansion from 16.4% toward 20%+ would drive outsized EPS growth |
| Potential M&A | Company has $337M cash and no debt; strategic acquisitions in AI software are possible |
Competitive Landscape and Related Equities
### Primary Competitors
| Company | Ticker | Market Share (Est.) | Notes |
|---|---|---|---|
| Keyence Corporation | 6861.T | ~25% | Dominant in factory automation sensors; strong direct sales model |
| Basler AG | BSL.DE | ~5% | German industrial camera manufacturer |
| Omron Corporation | 6645.T | ~5% | Broad automation portfolio including vision systems |
| Teledyne Technologies | TDY | ~4% | Industrial imaging and machine vision via Teledyne DALSA |
| ISRA VISION (acquired by Atlas Copco) | ATCO-A.ST | ~3% | Surface inspection specialist |
| AI-Native Startups | Private | <2% | Emerging deep-learning vision companies (e.g., Landing.ai, Drishti) |
Related Equities Frequently Mentioned with CGNX
| Ticker | Relationship |
|---|---|
| ROK (Rockwell Automation) | Industrial automation peer; often compared for factory automation exposure; Rockwell partners with Cognex in some integrated solutions. |
| EMR (Emerson Electric) | Diversified industrial automation player; Cognex competes in discrete manufacturing segments. |
| TER (Teradyne) | Shares similar exposure to consumer electronics and semiconductor end markets; Teradyne’s Universal Robots division complements Cognex in automation. |
| ISRG (Intuitive Surgical) | Occasionally mentioned in AI-vision context, though in medical robotics; both leverage advanced imaging and AI. |
| NVDA (NVIDIA) | Key technology partner; NVIDIA GPUs power Cognex’s deep learning inference; AI ecosystem alignment is a frequent discussion point. |
Investment Thesis
Bull Case
1. AI-Driven TAM Expansion: The OneVision cloud platform and deep learning tools position Cognex to capture a larger share of the AI-powered inspection market, which is estimated to grow from $5B to $15B+ by 2030 (estimate).
2. Margin Recovery Trajectory: With FY2025 operating margins at 16.4% and management’s focus on operational efficiency, there is clear path toward 20%+ operating margins, driving EPS growth of 50%+ in FY2026E.
3. Secular Automation Demand: EV battery manufacturing, semiconductor fab expansion, and logistics automation provide multi-year growth visibility. Revenue growth of 15.7% in FY2026E appears achievable given the 24.3% revenue growth reported in the latest quarter.
4. Balance Sheet Optionality: With $337M in cash and no debt, Cognex can fund strategic acquisitions, accelerate buybacks, or increase dividends.
Bear Case
1. Premium Valuation Risk: At 84x trailing earnings and 40x forward earnings, the stock prices in flawless execution. Any macro-driven revenue miss would trigger significant multiple compression.
2. China Geopolitical Risk: With ~20% of revenue from Greater China, escalating trade restrictions or local competition from Chinese machine vision companies (e.g., Hikrobot, Daheng Image) could erode market share.
3. Competitive Disruption: Keyence’s aggressive R&D spending and AI-native startups could commoditize traditional machine vision, pressuring Cognex’s 66.9% gross margin.
4. Cyclicality: The company’s history shows revenue volatility (FY2023: -16.8% growth), and a global manufacturing downturn would disproportionately impact high-multiple tech names.
Capital Raising Activity
Recent 6 Months (February 2026 – August 2026)
| Date | Activity | Details |
|---|---|---|
| Q1 2026 | Share Repurchases | Continued buyback program; diluted share count reduced from 169.4M (FY2025) to 168.4M (Q1 2026) |
| Q1 2026 | No Debt Issuance | Company remains debt-free (excluding capital leases) |
Projected Next 6 Months (August 2026 – February 2027)
Financial Summary Table
| Metric | FY2023 | FY2024 | FY2025 | FY2026E | FY2027E |
|---|---|---|---|---|---|
| Revenue ($M) | $837.55 | $914.52 | $994.36 | $1,150.0 | $1,300.0 |
| Gross Margin | 71.8% | 68.4% | 66.9% | 68.0% | 69.0% |
| Operating Margin | 14.7% | 12.6% | 16.4% | 20.0% | 22.3% |
| Net Income ($M) | $113.23 | $106.17 | $114.44 | $175.0 | $225.0 |
| Diluted EPS | $0.65 | $0.62 | $0.68 | $1.03 | $1.33 |
| Free Cash Flow ($M) | $89.84 | $134.04 | $236.77 | $250.0 | $300.0 |
| FCF Margin | 10.7% | 14.7% | 23.8% | 21.7% | 23.1% |
| Shares Outstanding (M) | 171.6 | 170.4 | 167.0 | 166.4 | 165.0 |
Key Data Points
| Metric | Value |
|---|---|
| Current Price (Implied) | ~$71.50 (based on market cap/shares) |
| 52-Week Range | $34.60 – $72.88 |
| Short Interest | 5.6% of float |
| Institutional Ownership | ~104.7% (includes over-ownership due to fund overlap) |
| Return on Equity | 9.7% |
| Gross Margin (TTM) | 68.0% |
| Operating Margin (TTM) | 22.3% |
| Revenue Growth (Latest Quarter YoY) | +24.3% |
| Earnings Growth (Latest Quarter YoY) | +122.3% |
Disclaimer: This report is for informational and educational purposes only and does not constitute investment advice. Data sourced from Yahoo Finance (as of August 05, 2026) and company filings; all estimates not explicitly sourced from the provided data are clearly labeled as such. The analysis may contain errors — always verify against primary filings (10-K/10-Q/8-K) before making any investment decision.
Discover more from CANSLIM Research
Subscribe to get the latest posts sent to your email.