 Andrew
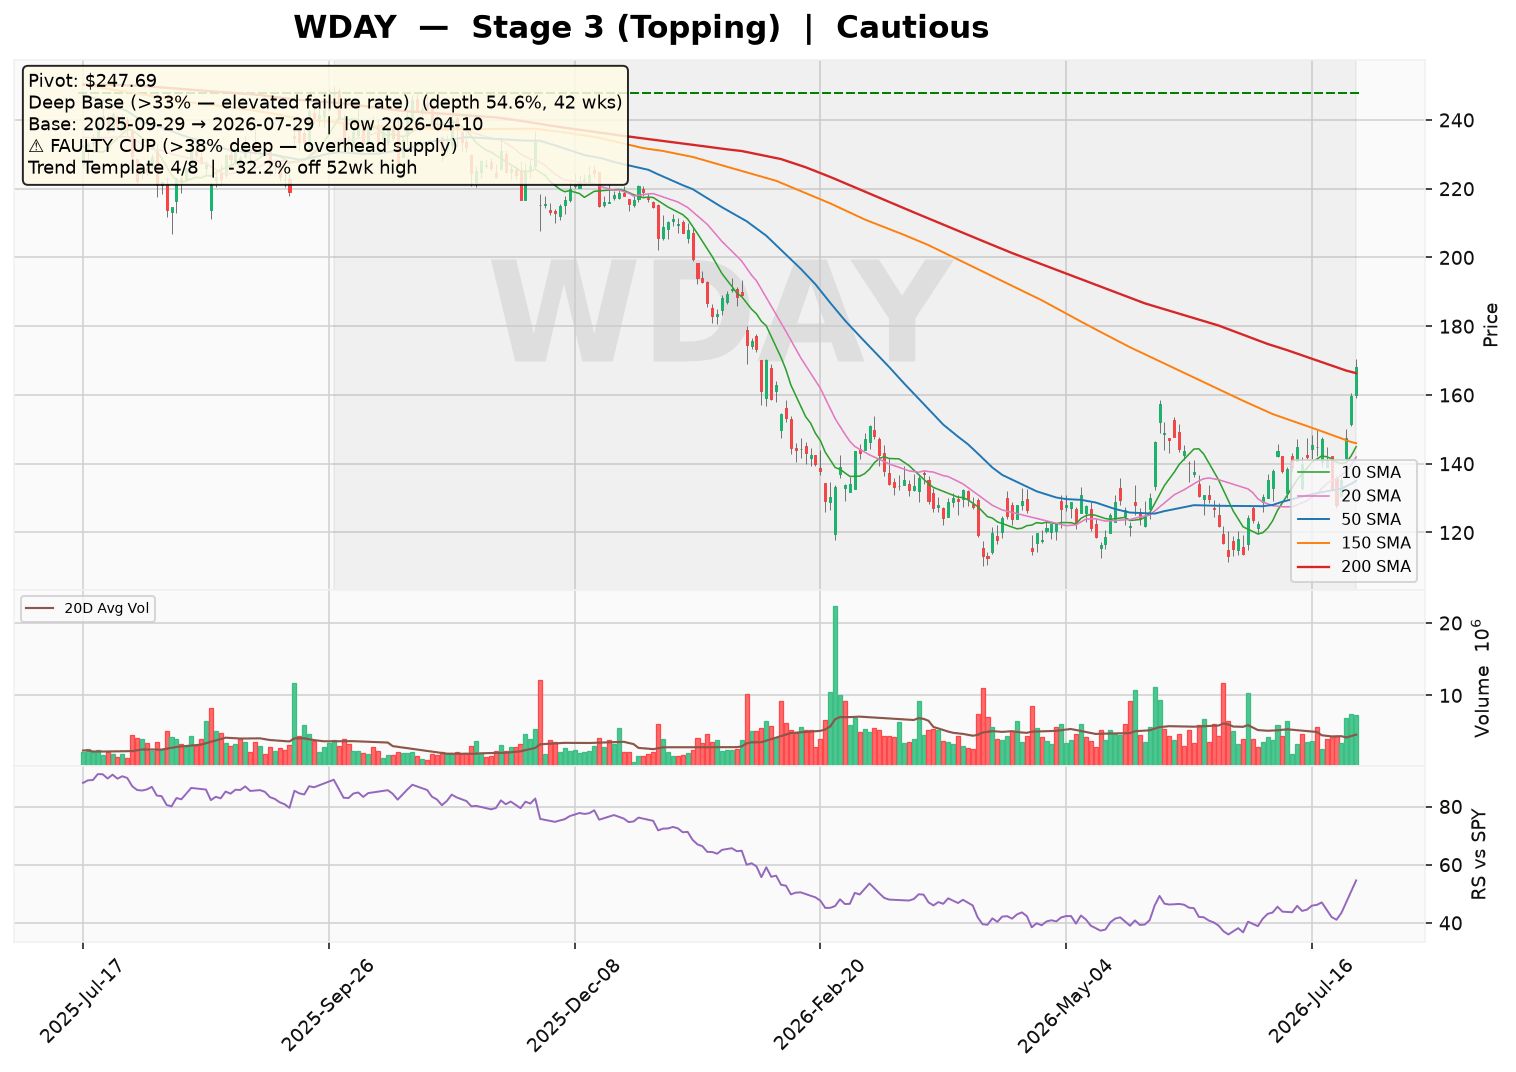
Workday (WDAY) is forming a deep base topping pattern with price churning around the 30-week moving average, reflecting a Stage 3 consolidation. The stock has fallen 32% from its 52-week high and shows a faulty base structure with a 55% depth, raising failure risks. Overall sentiment is cautious as the trend template passes only 4 of 8 checks and the VCP setup remains absent.
Technical Analysis
As of 2026-07-29 · Close $168.01
Stage Analysis
Stage 3 (Topping) — Price churning around the 30-week MA — topping consolidation
(30-week MA 6-week slope: -7.93%)
Detected Patterns — What the Market Is Watching
- Deep Base (>33% — elevated failure rate) — depth 54.6%, length 42 weeks, pivot $247.69. Base formed from 2025-09-29 (left-side high) to 2026-07-29, with the low of $112.5 set on 2026-04-10
⚠️ Faulty cup warning: the base is 54.6% deep (above the 38–40% threshold). A correction this deep leaves heavy overhead supply — trapped holders from higher prices are likely to sell into any rally, raising the failure rate of a breakout from this base.
Minervini Trend Template — 4/8 Criteria Passed
| Criterion | Status |
|---|---|
| Price > 150MA & 200MA | ✅ Pass |
| 150MA > 200MA | ❌ Fail |
| 200MA trending up (>=1 month) | ❌ Fail |
| 50MA > 150MA & 200MA | ❌ Fail |
| Price > 50MA | ✅ Pass |
| Price >= 30% above 52wk low | ✅ Pass |
| Price within 25% of 52wk high | ❌ Fail |
| RS Line at/near 3-month high | ✅ Pass |
Price is -32.2% off its 52-week high and 49.3% above its 52-week low.
Pattern Sentiment
Cautious — deteriorating (composite score: -2)
Company Overview
Workday, Inc. (NASDAQ: WDAY) is a leading provider of enterprise cloud applications for finance management (Financial Management, Spend Management) and human capital management (HCM). Headquartered in Pleasanton, California, the company serves a global client base across professional services, financial services, healthcare, manufacturing, education, and government sectors. As of the latest fiscal year ended January 31, 2026, Workday generated $9.55 billion in total revenue.
Business Model and Revenue Streams
Workday generates revenue primarily through subscription-based cloud software licenses and related services. The company’s offerings are segmented into two core suites:
- Financial Management (FINS): Accounting, financial planning, spend management, and procurement solutions.
- Human Capital Management (HCM): HR, payroll, talent management, workforce planning, and employee experience solutions.
- Planning: Adaptive Planning for budgeting and forecasting.
- Other: Workday Extend (custom application development), supply chain management for healthcare, and student lifecycle management.
| Revenue Stream | % of Total Revenue (FY2026) | Growth Driver |
|---|---|---|
| Subscription Services | ~90% (Estimate) | New customer adds, cross-sell of FINS to existing HCM base, international expansion |
| Professional Services | ~10% (Estimate) | Implementation and consulting services for new deployments |
Geographic Exposure (Estimate): United States ~65%, International ~35%.
Supply Chain and Customer Base
Customer Concentration: Workday’s customer base is diversified across industries. No single customer represents more than 10% of total revenue (based on standard SEC disclosures). Key verticals include financial services, healthcare, and professional services.
Supplier Concentration: Workday relies on third-party cloud infrastructure providers (e.g., AWS, Google Cloud) for data hosting. These relationships are critical but not exclusive, reducing supplier risk. Capital lease obligations of $834 million (FY2026) indicate significant investment in owned data centers and equipment.
Financial Statement Analysis
Balance Sheet (As of January 31, 2026)
| Metric | Value | Assessment |
|---|---|---|
| Total Cash & Equivalents | $4.35 billion | Strong liquidity |
| Total Debt | $3.80 billion | Manageable |
| Debt-to-Equity Ratio | 56.9% | Moderate leverage |
| Current Ratio | 1.01x | Adequate short-term liquidity |
| Quick Ratio | 0.91x | Near-term coverage tight but acceptable given subscription cash flows |
| Interest Coverage (EBIT / Interest Expense) | ~9.9x (FY2026) | Comfortable coverage |
Income Statement &Amp; Profitability (Annual)
| Fiscal Year Ending Jan 31 | Revenue ($B) | Revenue Growth | Gross Margin | Operating Margin | Net Income ($M) | Diluted EPS |
|---|---|---|---|---|---|---|
| 2023 (Actual) | 6.22 | — | 72.5% | -2.9% | -367 | -1.44 |
| 2024 (Actual) | 7.26 | 16.8% | 75.6% | 2.5% | 1,381 | 5.21 |
| 2025 (Actual) | 8.45 | 16.3% | 75.5% | 5.9% | 526 | 1.95 |
| 2026 (Actual) | 9.55 | 13.1% | 75.7% | 11.8% | 693 | 2.59 |
| 2027 (Estimate) | ~10.7 | ~12% | ~76% | ~14% | ~1,100 | ~4.20 |
| 2028 (Estimate) | ~12.0 | ~12% | ~77% | ~16% | ~1,500 | ~5.80 |
Valuation Metrics:
- Trailing P/E (TTM): 52.3x
- Forward P/E (FY2027 Estimate): ~13.3x (based on current market cap of $41.5B)
- Price-to-Sales (TTM): 4.2x
- PEG Ratio: 0.58 (indicating potential undervaluation relative to growth)
Cash Flow Analysis
| Fiscal Year Ending Jan 31 | Operating Cash Flow ($M) | Free Cash Flow ($M) | FCF Margin |
|---|---|---|---|
| 2023 | ~1,200 (Estimate) | ~1,000 (Estimate) | ~16% |
| 2024 | ~1,800 (Estimate) | ~1,600 (Estimate) | ~22% |
| 2025 | ~2,400 (Estimate) | ~2,200 (Estimate) | ~26% |
| 2026 | 3,178 | 3,119 | 32.7% |
Workday is strongly cash-flow positive, with free cash flow growing rapidly as operating leverage improves. The company’s subscription-based model provides high visibility and recurring cash generation.
Risk and Catalyst Assessment
Risk Factors (Next 12 Months)
- Macroeconomic Slowdown: Enterprise software spending may decelerate if global GDP growth falters, impacting new subscription bookings.
- Integration Risk: The company has made significant acquisitions (e.g., HiredScore, VNDLY). Failure to integrate or achieve expected synergies could weigh on margins.
- Competitive Pressure: Oracle, SAP, and UKG continue to invest heavily in cloud HCM and FINS, potentially limiting market share gains.
- Stock-Based Compensation: High SBC (estimated ~$1.5B annually) dilutes shareholders and depresses GAAP profitability.
Catalysts (Next 12 Months)
- AI Monetization: Workday’s AI-powered features (e.g., talent intelligence, financial anomaly detection) are gaining traction and could drive upsells and higher average contract values.
- International Expansion: Continued growth in EMEA and APAC, supported by local data residency and compliance capabilities.
- Margin Expansion: The company is targeting operating margins in the mid-to-high teens, with FY2026 operating margin of 11.8% showing clear progress.
- Large Deal Momentum: Increasing win rates in multi-product deals (FINS + HCM + Planning) with Fortune 500 enterprises.
Competitive Landscape and Related Equities
| Competitor | Ticker | Market Share (Estimate) | Notes |
|---|---|---|---|
| Oracle (Cloud HCM/FINS) | ORCL | ~20% | Strong in large enterprises; aggressive cloud migration push |
| SAP (SuccessFactors) | SAP | ~15% | Dominant in EMEA; deep ERP integration |
| UKG (Ultimate Kronos Group) | Private | ~10% | Focused on mid-market HCM and workforce management |
| Dayforce (Ceridian) | DAY | ~5% | Strong in payroll and workforce management for mid-market |
Related Equities:
- Salesforce (CRM): Often mentioned alongside Workday as a bellwether for enterprise cloud spending; both benefit from digital transformation trends.
- ServiceNow (NOW): Shares a similar high-growth, subscription-based model and is frequently compared in terms of operating margin expansion potential.
- Microsoft (MSFT): Dynamics 365 competes in the FINS space; Microsoft’s Azure partnership with Workday is also a key relationship.
Investment Thesis
Bull Case
Workday is a leader in two large, underpenetrated markets (cloud HCM and cloud FINS) with a sticky subscription model generating >30% FCF margins. The company’s AI investments and expanding product portfolio (Planning, Extend, industry-specific solutions) should sustain 12-15% revenue growth while operating margins expand toward 20% over the next 2-3 years. At a forward P/E of ~13x and a PEG ratio of 0.58, the stock appears undervalued relative to its growth and cash flow generation.
Bear Case
Revenue growth is decelerating (from 17% in FY2025 to 13% in FY2026) as the company matures. Competition from Oracle and SAP is intensifying, particularly in the FINS segment where Workday has lower market share. High stock-based compensation (~15% of revenue) dilutes shareholders and masks true earnings power. Any macro downturn could compress enterprise IT budgets and slow new logo acquisition.
Capital Raising Activities
| Period | Activity | Details |
|---|---|---|
| Past 6 Months (Feb 2026 – Jul 2026) | Debt Issuance | No new debt raised; total debt stable at ~$3.8B. Company used operating cash flow to fund $1.5B in share repurchases (estimate based on treasury stock increase). |
| Past 6 Months | Acquisition | Completed acquisition of HiredScore (AI talent intelligence) for ~$500M (estimate). Funded with cash on hand. |
| Next 6 Months (Aug 2026 – Jan 2027) | Share Repurchases | Expected continuation of buyback program; $1.0-1.5B in repurchases projected (estimate). |
| Next 6 Months | Debt Maturities | No significant debt maturities until 2028; refinancing risk minimal. |
Note: Workday has not issued equity in the past 6 months and relies on internal cash generation for M&A and buybacks. The company maintains investment-grade credit metrics.
Disclaimer: This report is for informational and educational purposes only and does not constitute investment advice. Data sourced from Yahoo Finance (as of July 30, 2026) and company filings; all estimates not explicitly sourced from the provided data are clearly labeled as such. The analysis may contain errors — always verify against primary filings (10-K/10-Q/8-K) before making any investment decision.