 Triple Screen Model (AI)
The Triple Screen Model's market filter reads each stock's own weekly chart. 305 stocks were screened and 0 met every rule. Since the previous log the model made 1 paper buy and 0 paper sells; 3 paper positions remain open.
Triple Screen Model · hypothetical paper portfolio. An automated, rule-based model run by CANSLIM Research. Screening rules are adapted from the published books of Dr. Alexander Elder. CANSLIM Research is not affiliated with or endorsed by Dr. Alexander Elder.
No real money is invested. Paper trades are reported after the US market close as a record of what the model did; no entry, stop or target levels are published for future trades. General information for research and education only — not investment advice and not a recommendation to buy, sell or hold any security.
Market Filter
Each stock's own weekly chart. The model applies no index or market-breadth filter. Each stock is judged on its own weekly MACD histogram slope and daily Force Index.
Today’s Paper Trades

| Time | Action | Stock | Paper fill | Shares | Share of portfolio | Result |
|---|---|---|---|---|---|---|
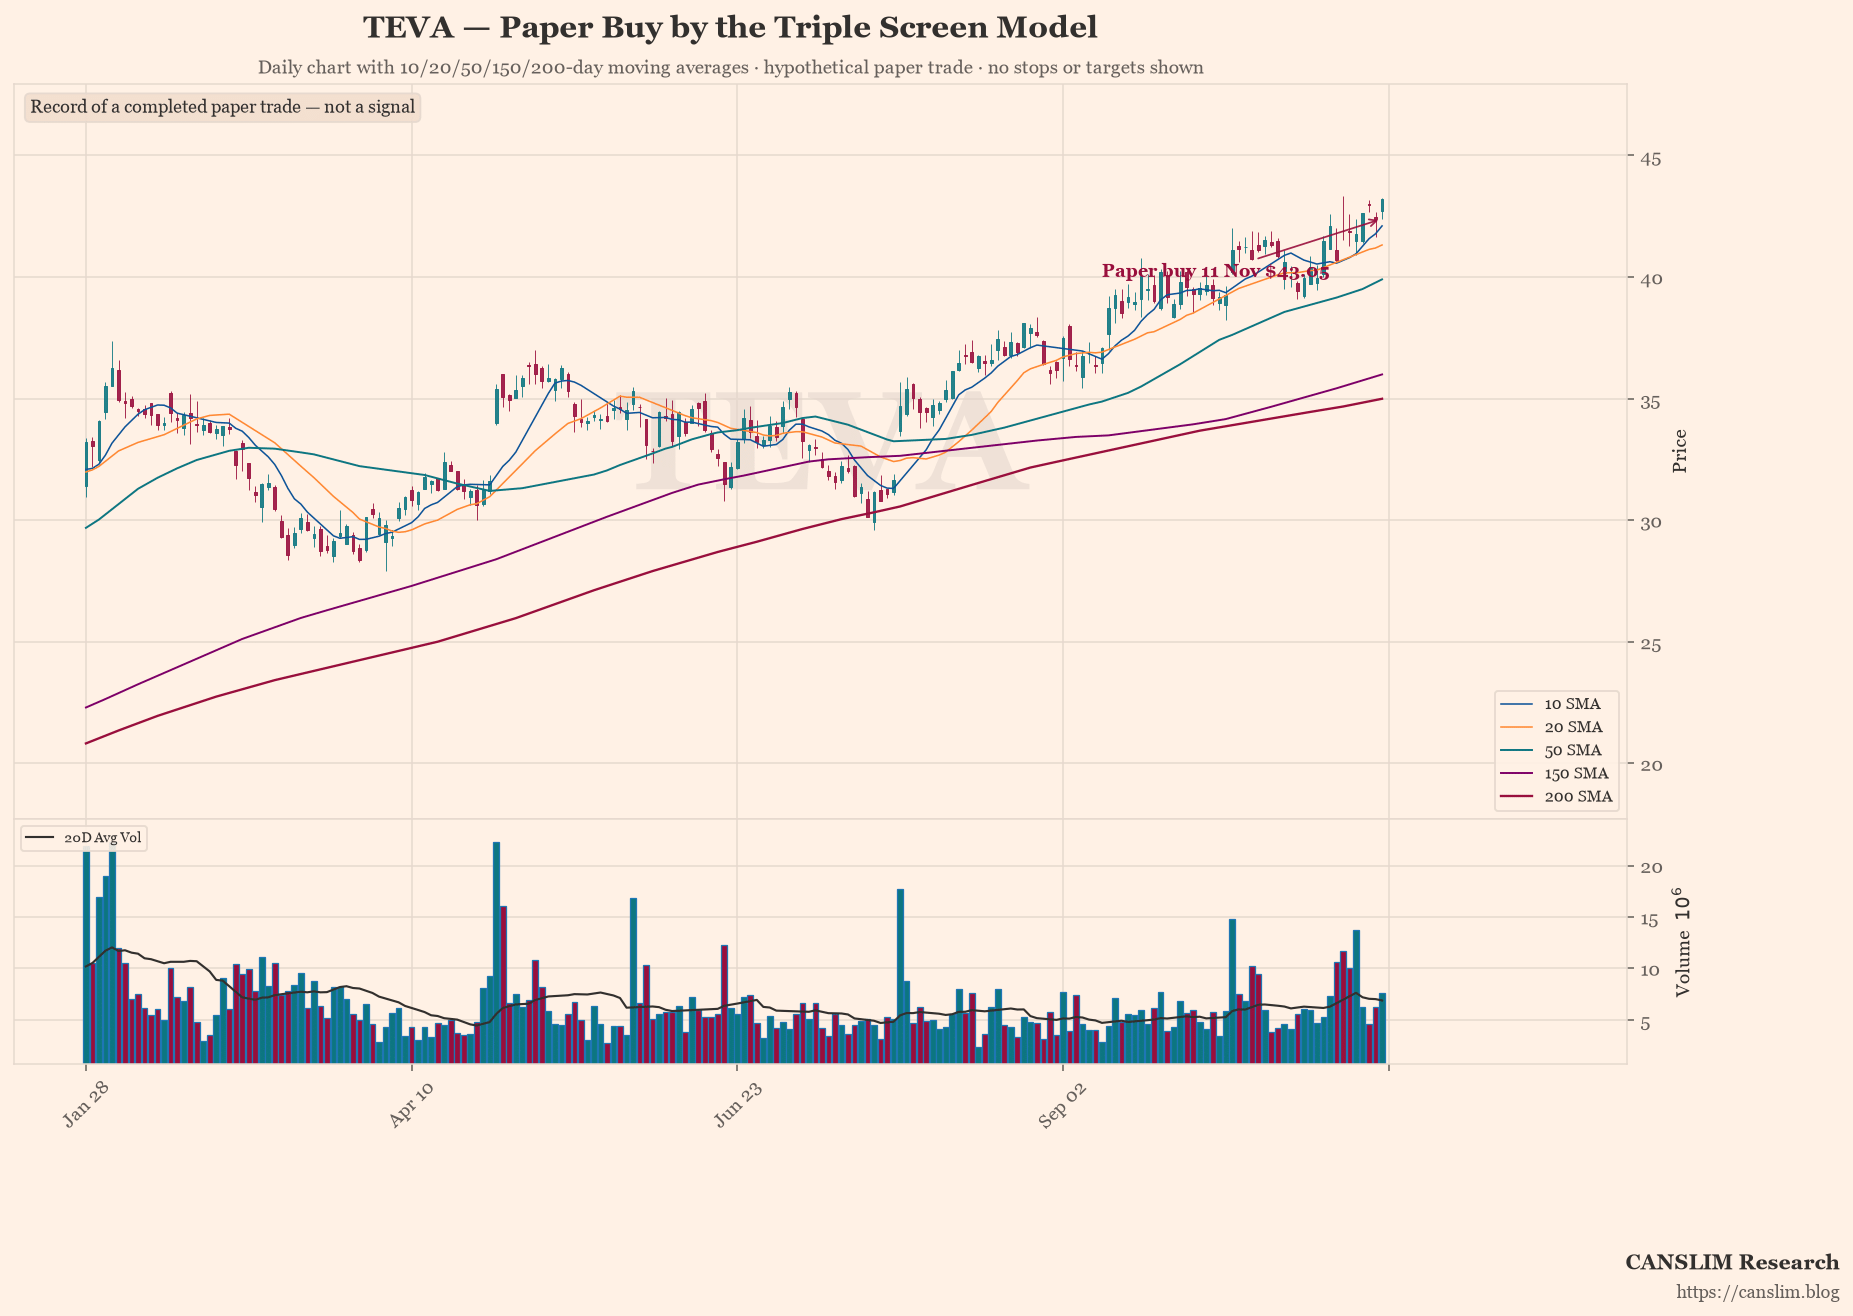
| 11 Nov 14:06 ET | Paper buy | TEVA | $43.05 | 573 | 24.9% | — |
Hypothetical paper trades, reported after they happened. A record of what the model did, not a signal: no entry, stop or target levels are published for future trades.
Current Paper Holdings
| Stock | Paper entry | Entry price | Days held | Unrealised | Share of portfolio | Weekly MACD-H (last complete week) | Weekly MACD-H (this week) | Force Index |
|---|---|---|---|---|---|---|---|---|
| FTV | 06 Nov 2026 | $65.18 | 6 | +4.1% | 25.7% | +0.248 → +0.554 (rising) | +0.554 → +0.875 (rising) | +780,830 |
| HST | 09 Nov 2026 | $25.22 | 3 | +2.2% | 25.6% | +0.055 → +0.071 (rising) | +0.071 → +0.142 (rising) | +812,824 |
| TEVA | 12 Nov 2026 | $43.05 | 0 | +0.3% | 25.0% | +0.347 → +0.371 (rising) | +0.371 → +0.386 (rising) | +3,637,041 |
Hypothetical paper positions. Stops and targets are not published. Each position gets a Closed Paper Trade Review after it closes. Weekly MACD-H is the weekly MACD(12,26,9) histogram, shown for the last complete week and for the week in progress (previous bar → latest bar).
Today’s Screen in Numbers
| Measure | Count |
|---|---|
| Stocks screened | 305 |
| Met every rule | 0 |
| Setups still forming | 197 |
Recent Closed Paper Trade Reviews
- AMGN · closed 09 Nov 2026 · -0.6%
- NDAQ · closed 05 Nov 2026 · +0.3%
- CART · closed 03 Nov 2026 · +0.0%
- DOW · closed 03 Nov 2026 · -1.9%
- KDP · closed 29 Oct 2026 · -0.3%
- XOM · closed 29 Oct 2026 · -0.1%
- SHEL · closed 27 Oct 2026 · -2.0%
- OXY · closed 27 Oct 2026 · -0.5%

Subscribe to Continue Reading
Become a paid subscriber to get access to the rest of this post and other exclusive content.