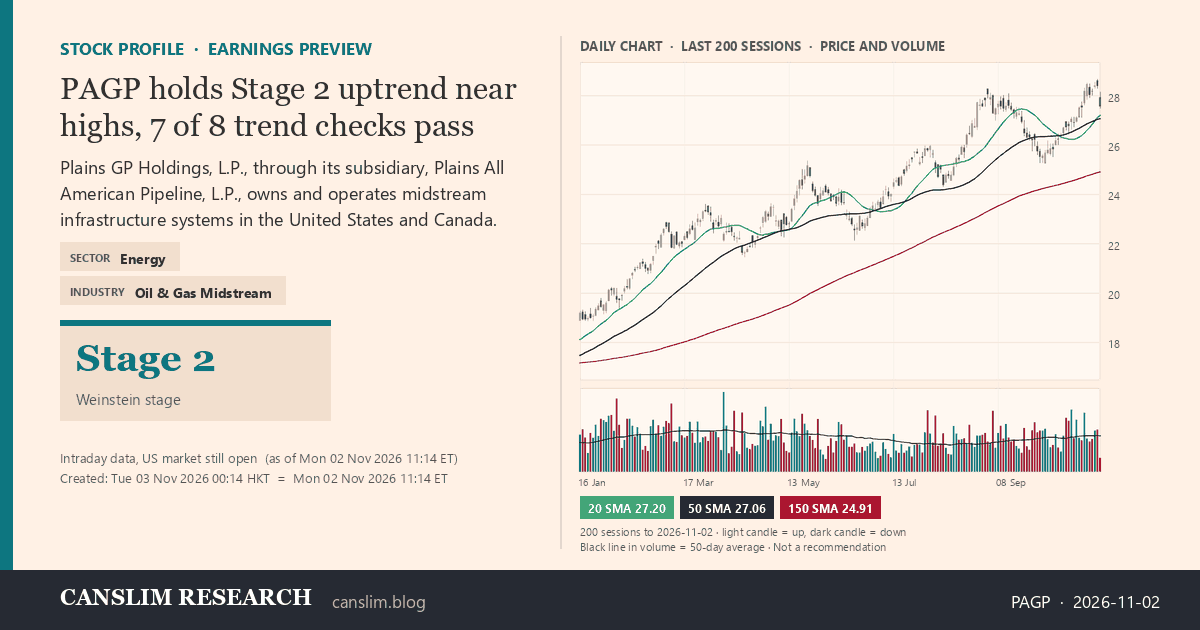
PAGP is trading at 27.56, holding above a rising 30-week moving average in a Stage 2 advancing phase with the uptrend intact. The stock sits just 3.1% off its 52-week high and 71.8% above its 52-week low, passing 7 of 8 trend template checks, with the relative strength line the only miss. No base or VCP has formed given the short consolidation, but sentiment is bullish with an offensive setup in place.
PAGP Daily · data to 2026-11-02 close · 20 SMA 50 SMA 150 SMA
Frozen at publication – this chart does not move. Open live chart on TradingView →
SECTOREnergyINDUSTRYOil & Gas MidstreamStage 2Weinstein stage
Intraday data, US market still open (as of Mon 02 Nov 11:14 ET)Created: Tue 03 Nov 00:14 HKT = 11:14 ET
Inside the Full Report
- 🔒
Stage AnalysisWhy the stock sits in this stage and what would change that
- 🔒
Detected PatternsWhich setups the scan found, with buy point and failure level
- 🔒
Trend Template: All 8 ChecksWhich criteria pass, which fail, and by how much
- 🔒
Fundamental SnapshotGrowth, margins, valuation and the earnings date
Disclaimer: This report is for informational and educational purposes only and does not constitute investment advice. Figures come from the scanned result (as of November 03, 2026) and company filings; all estimates not explicitly sourced from the provided data are clearly labeled as such. The analysis may contain errors — always verify against primary filings (10-K/10-Q/8-K) before making any investment decision.
Continue Reading
This article is for pass holders.
Most Flexible
30-Day Pass$12.00One-time purchase · no auto-renewalBuy 30 DaysSave $24.00
365-Day Pass$120.00$144.00One-time purchase · no auto-renewalBuy 365 Days
30-Day Pass$12.00One-time purchase · no auto-renewalBuy 30 DaysSave $24.00
365-Day Pass$120.00
Already a pass holder? Sign in · Continue with Google