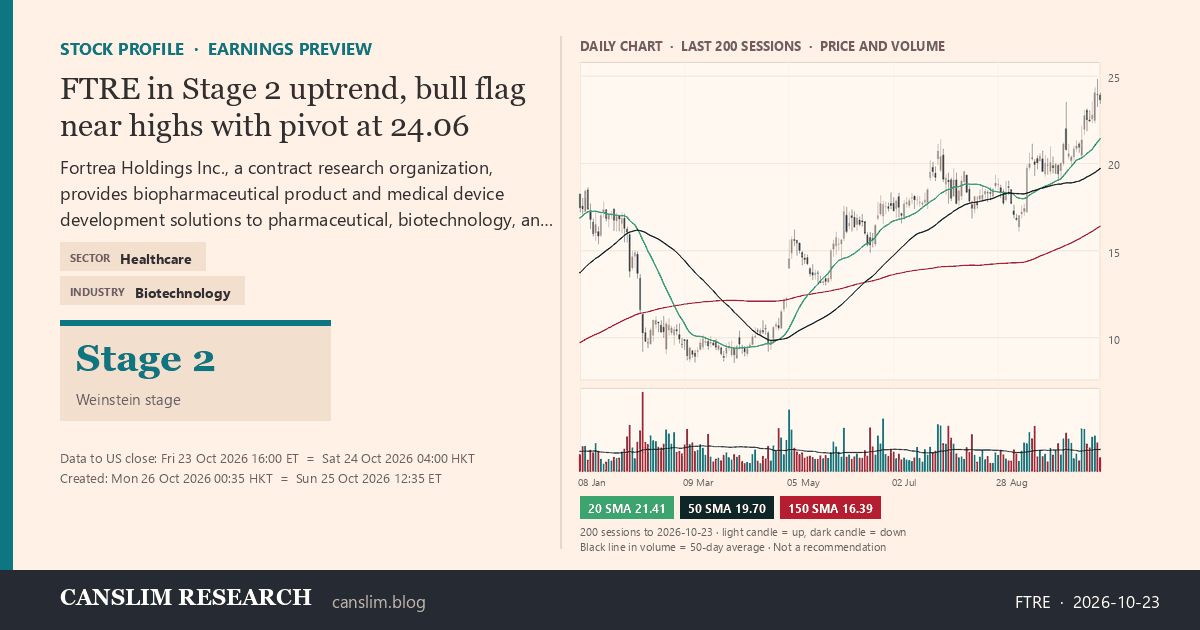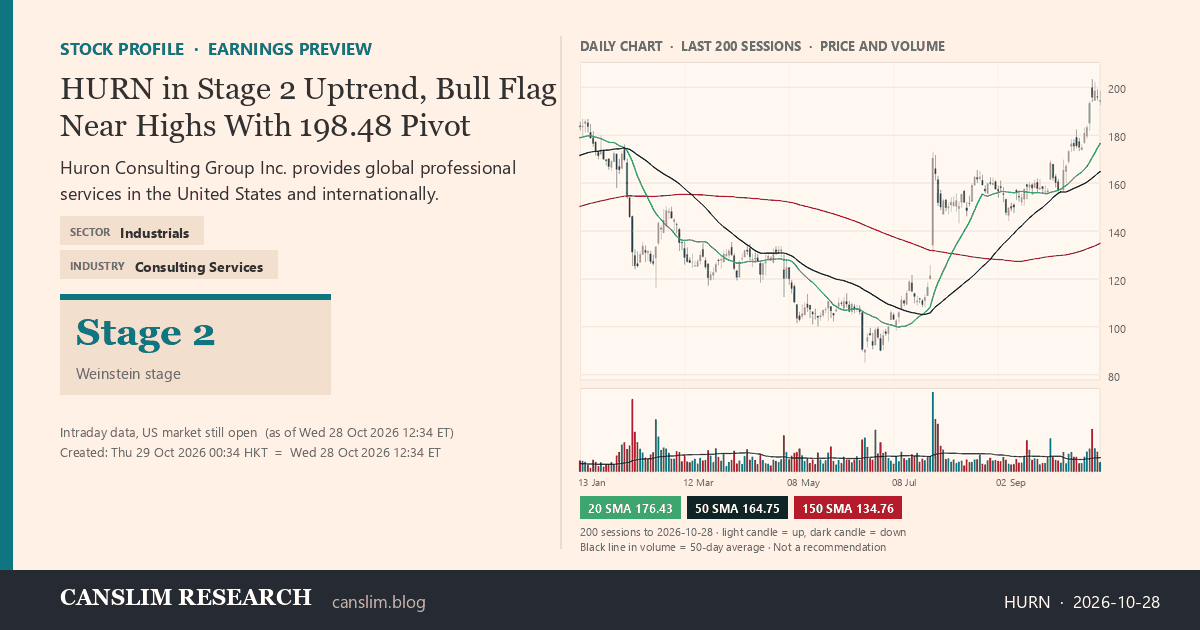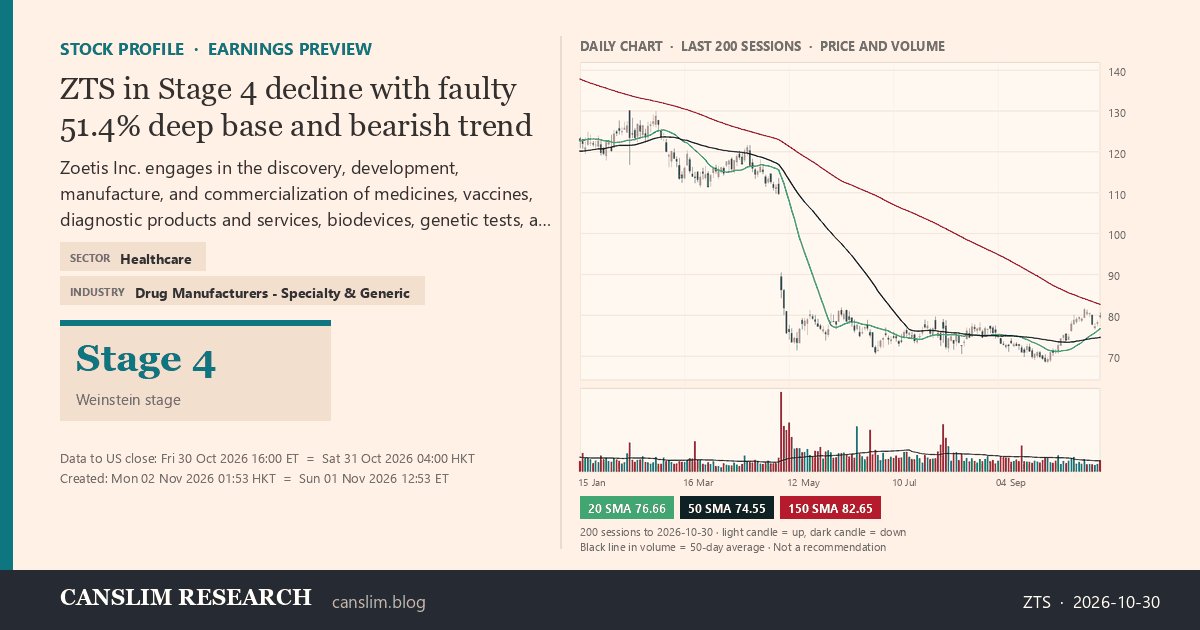
ZTS is trading at 79.72 in a confirmed Stage 4 downtrend, sitting below a declining 30-week moving average and roughly 43.5% off its 52-week high. The market focus is on a faulty deep base of 51.4% depth built over 50 weeks, with no VCP contraction and only one of eight trend-template checks passing. Overall sentiment is bearish and defensive, with elevated base-failure risk.
ZTS Daily · data to 2026-10-30 close · 20 SMA 50 SMA 150 SMA
Frozen at publication – this chart does not move. Open live chart on TradingView →
SECTORHealthcareINDUSTRYDrug Manufacturers – Specialty & GenericStage 4Weinstein stage
Data to US close: Fri 30 Oct 16:00 ET = Sat 31 Oct 04:00 HKTCreated: Mon 02 Nov 01:53 HKT = 12:53 ET
Inside the Full Report
- 🔒
Stage AnalysisWhy the stock sits in this stage and what would change that
- 🔒
Detected PatternsWhich setups the scan found, with buy point and failure level
- 🔒
Trend Template: All 8 ChecksWhich criteria pass, which fail, and by how much
- 🔒
Fundamental SnapshotGrowth, margins, valuation and the earnings date
Disclaimer: This report is for informational and educational purposes only and does not constitute investment advice. Figures come from the scanned result (as of November 02, 2026) and company filings; all estimates not explicitly sourced from the provided data are clearly labeled as such. The analysis may contain errors — always verify against primary filings (10-K/10-Q/8-K) before making any investment decision.
Continue Reading
This article is for pass holders.
Most Flexible
30-Day Pass$12.00One-time purchase · no auto-renewalBuy 30 DaysSave $24.00
365-Day Pass$120.00$144.00One-time purchase · no auto-renewalBuy 365 Days
30-Day Pass$12.00One-time purchase · no auto-renewalBuy 30 DaysSave $24.00
365-Day Pass$120.00
Already a pass holder? Sign in · Continue with Google
Discover more from CANSLIM Research
Subscribe to get the latest posts sent to your email.