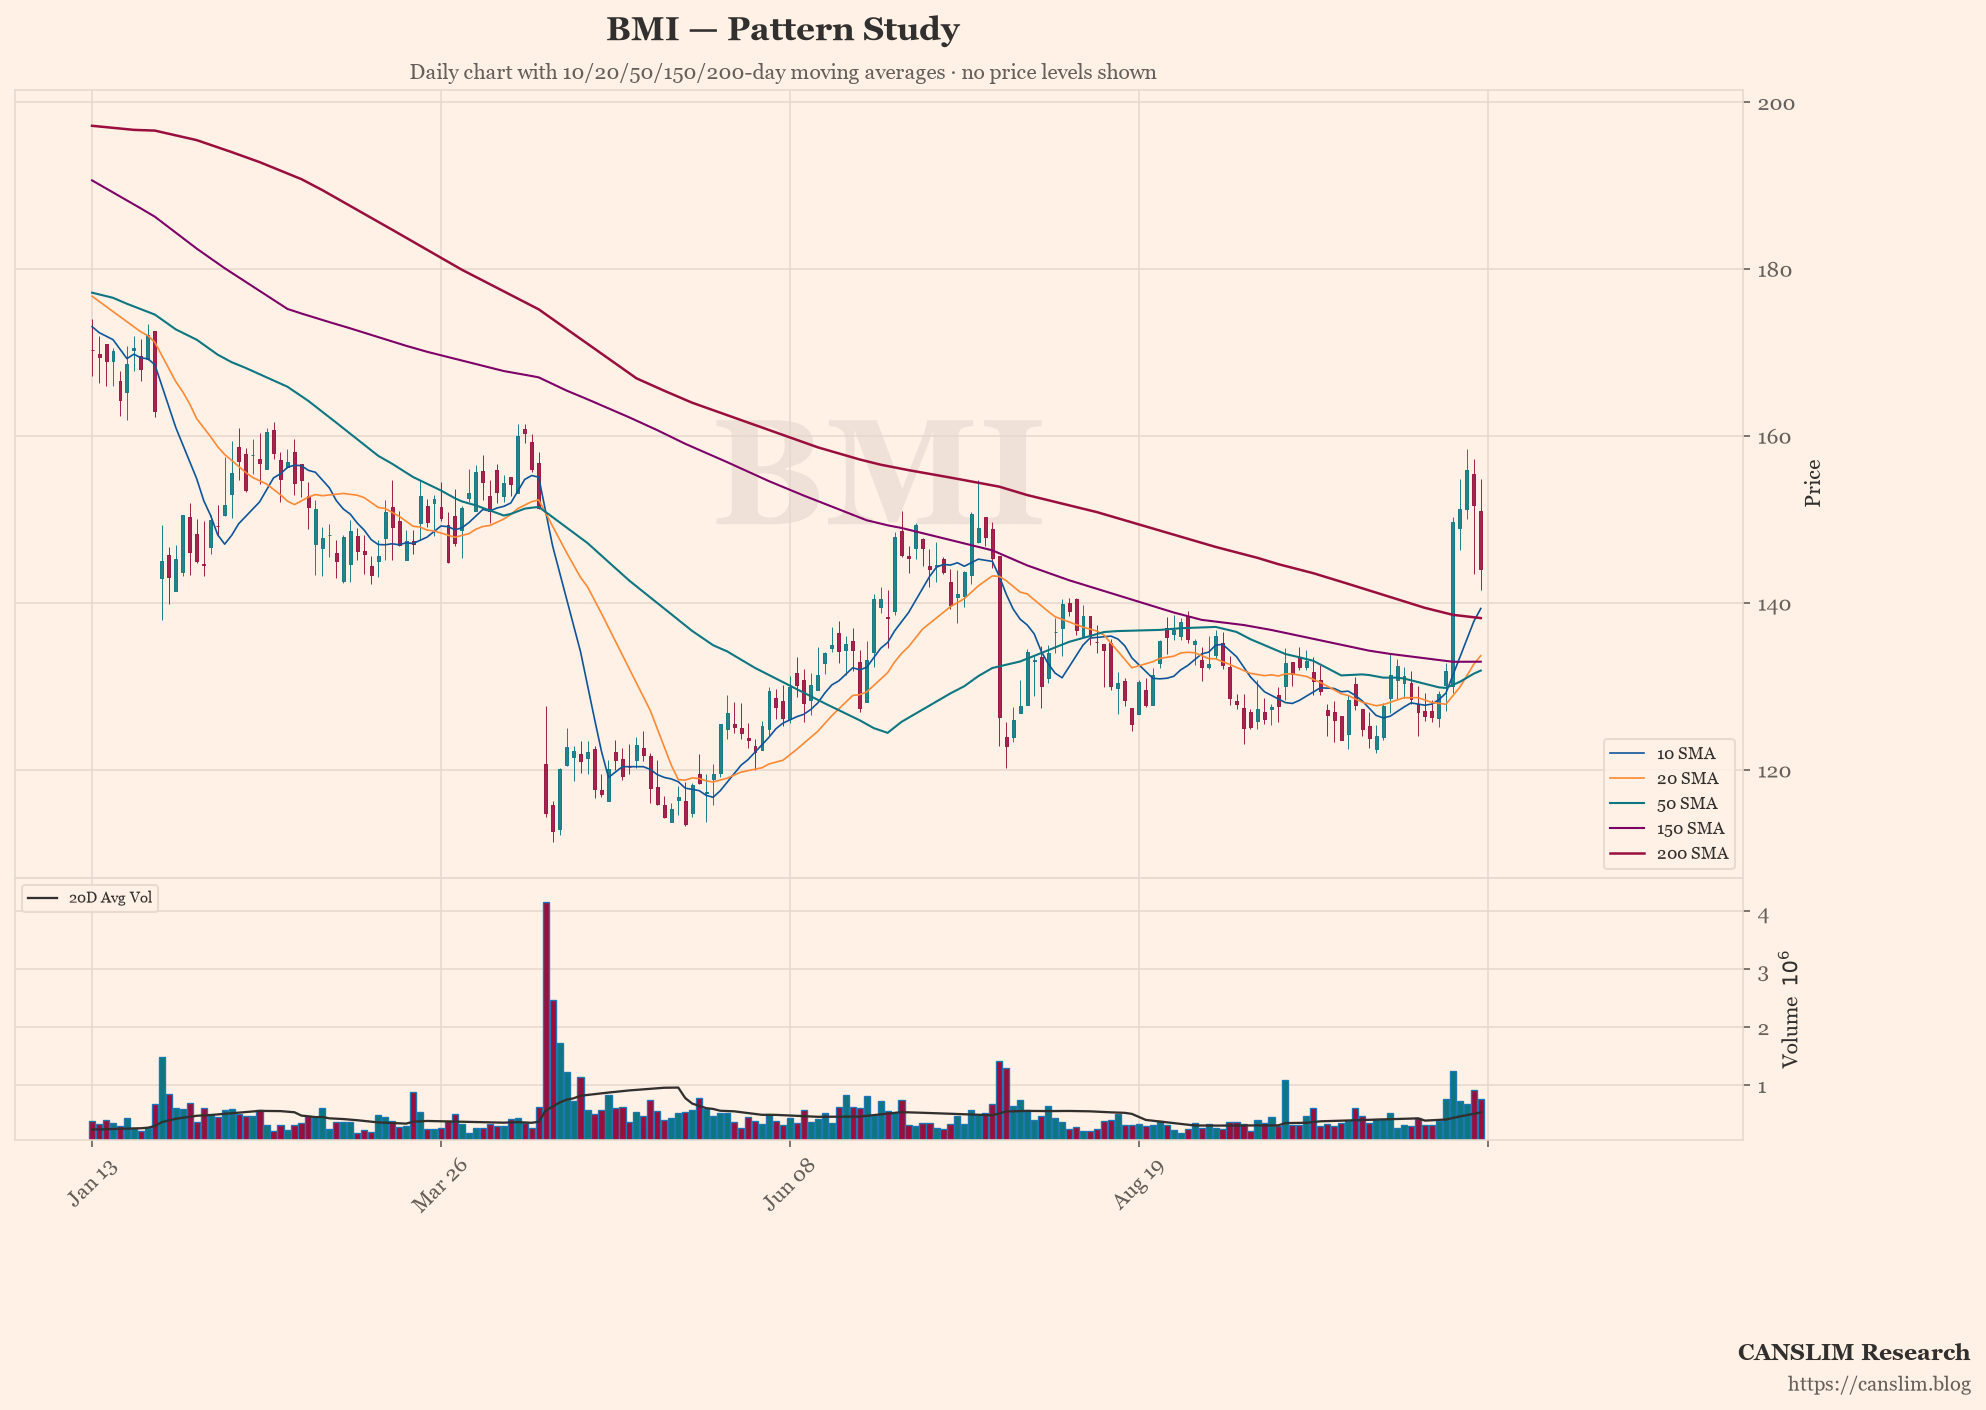
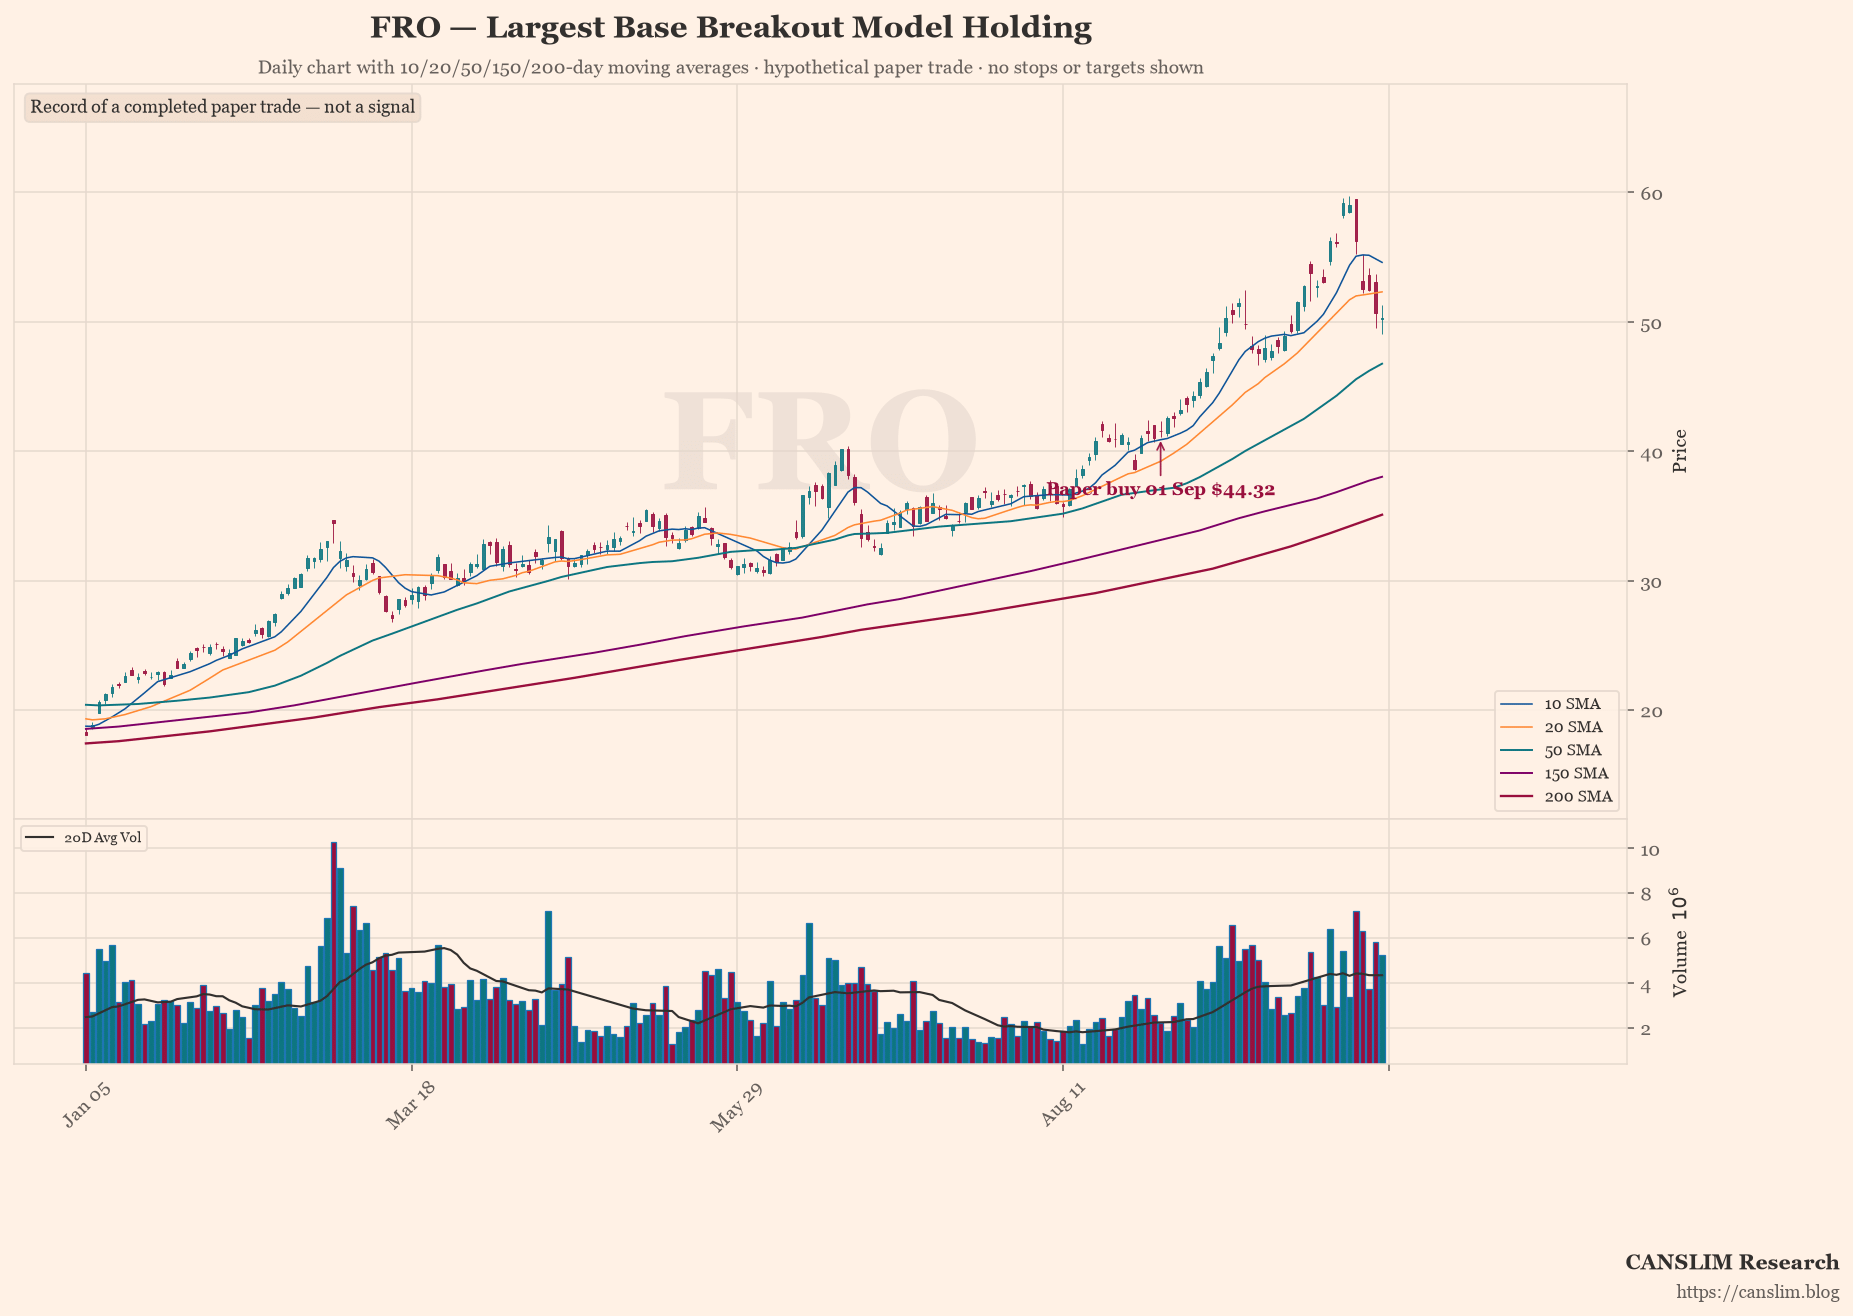
The Triple Screen Model's market filter reads each stock's own weekly chart. 227 stocks were screened and 0 met every rule. Since the previous log the model made 2 paper buys and 0 paper sells; 2 paper positions remain open.
Each stock's own weekly chart. The model applies no index or market-breadth filter. Each stock is judged on its own weekly MACD histogram slope and daily Force Index.
Hypothetical paper trades, reported after they happened. A record of what the model did, not a signal: no entry, stop or target levels are published for future trades.
Hypothetical paper positions. Stops and targets are not published. Each position gets a Closed Paper Trade Review after it closes. Weekly MACD-H is the weekly MACD(12,26,9) histogram, shown for the last complete week and for the week in progress (previous bar → latest bar).
Continue Reading
This article is for pass holders.
30-Day Pass$12.00One-time purchase · no auto-renewalBuy 30 DaysSave $24.00
365-Day Pass$120.00
Already a pass holder? Sign in · Continue with Google