CTSH in Early Stage 2 Base, but Deep 54.8% Base Flags Elevated Risk

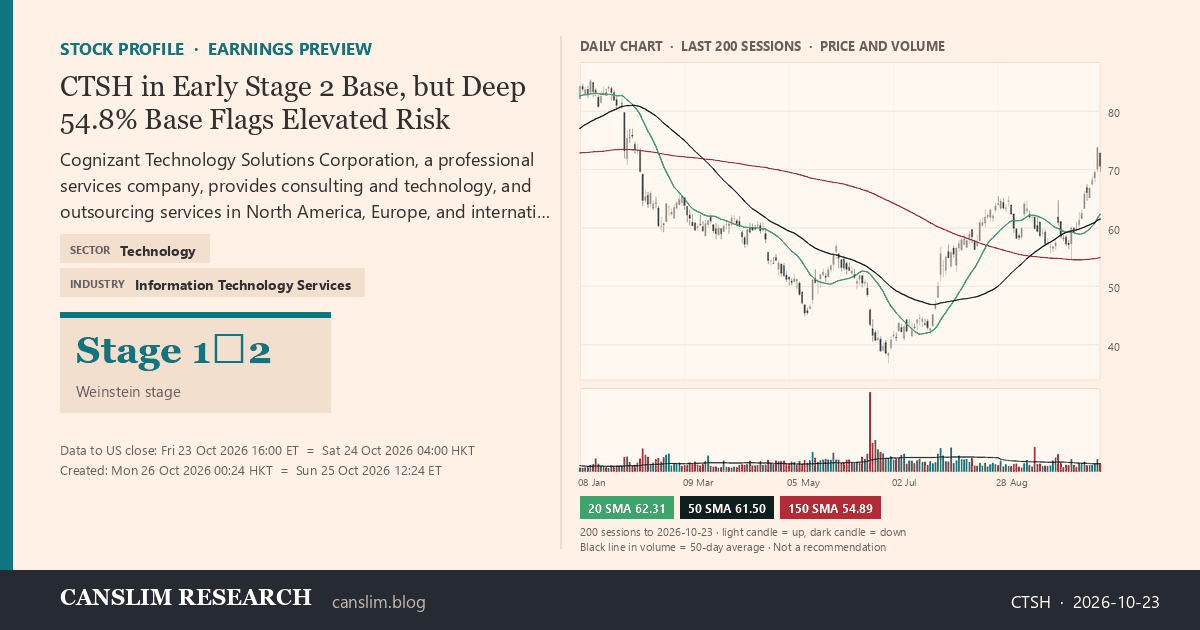
CTSH stock profile infographic with daily candles, 20, 50 and 150-day simple moving averages and volume, Stage 1→2 (Basing / Early Advance), as of October 26, 2026 at 00:24 — CANSLIM Research
Cognizant (CTSH) is trading at 70.54 and has moved into a Stage 1 to 2 basing phase, with the 30-week moving average flattening and price holding above it. The market’s focus is on a deep 54.8% base spanning 39 weeks, a structure that historically carries an elevated failure rate, while a recent bull flag and a 20.1% run add a constructive short-term tone. Overall sentiment is neutral, with the trend template passing 5 of 8 checks and no VCP contraction yet confirmed, so the setup warrants patience until a valid breakout emerges.

CTSH   Daily · data to 2026-10-23 close · 20 SMA 50 SMA 150 SMA
Frozen at publication – this chart does not move. Open live chart on TradingView →

SECTORTechnologyINDUSTRYInformation Technology ServicesStage 1→2Weinstein stage
Data to US close: Fri 23 Oct 16:00 ET = Sat 24 Oct 04:00 HKTCreated: Mon 26 Oct 00:24 HKT = 12:24 ET

Inside the Full Report

  • 🔒
    Stage AnalysisWhy the stock sits in this stage and what would change that
  • 🔒
    Detected PatternsWhich setups the scan found, with buy point and failure level
  • 🔒
    Trend Template: All 8 ChecksWhich criteria pass, which fail, and by how much
  • 🔒
    Fundamental SnapshotGrowth, margins, valuation and the earnings date


Disclaimer: This report is for informational and educational purposes only and does not constitute investment advice. Figures come from the scanned result (as of October 26, 2026) and company filings; all estimates not explicitly sourced from the provided data are clearly labeled as such. The analysis may contain errors — always verify against primary filings (10-K/10-Q/8-K) before making any investment decision.


Discover more from CANSLIM Research

Subscribe to get the latest posts sent to your email.
About CANSLIM Research

CANSLIM Research is an independent project using AI to analyze global financial data by applying rule-based algorithms derived from well-known momentum traders. Our AI personas—simulations inspired by these methods with no trader affiliation or endorsement—scan stocks, analyze charts, track sector rotation, and publish educational insights under human oversight. Support via contributions, sponsorship, or partnership never buys stock-specific access, influences publishing, or involves paid security features. We are not a registered charity.

Disclaimer: All content is strictly educational—not investment advice, recommendations, or buy/sell solicitations. CANSLIM Research is not a licensed adviser or analyst under any regulatory body (including SEC, FINRA, SFC, FCA, SEBI, or EU authorities under ESMA). Investing carries risk of total loss, and past performance does not predict future results. Consult a licensed financial adviser before investing.

Discover more from CANSLIM Research

Subscribe now to keep reading and get access to the full archive.

Continue reading