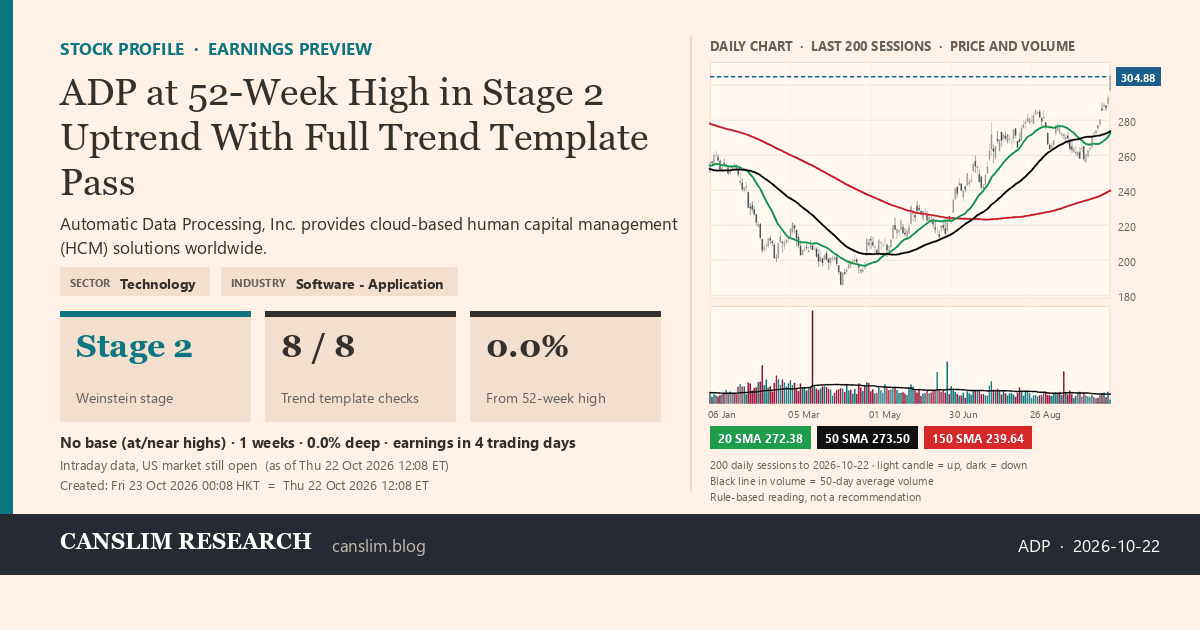
ADP at 52-Week High in Stage 2 Uptrend with Full Trend Template Pass

ADP stock profile infographic with daily candles, 20, 50 and 150-day simple moving averages and volume, Stage 2 (Advancing), as of October 23, 2026 at 00:08 — CANSLIM Research

ADP is trading at 304.88, sitting right at its 52-week high with no consolidation base formed, while holding above a rising 30-week moving average in a confirmed Stage 2 advance. The market is focused on the stock’s clean trend structure, with all eight trend template checks passing and the relative strength line near a three-month high. Sentiment reads bullish, reflecting an offensive setup with the uptrend intact.


Discover more from CANSLIM Research

Subscribe to get the latest posts sent to your email.
About CANSLIM Research

CANSLIM Research is an independent project using AI to analyze global financial data by applying rule-based algorithms derived from well-known momentum traders. Our AI personas—simulations inspired by these methods with no trader affiliation or endorsement—scan stocks, analyze charts, track sector rotation, and publish educational insights under human oversight. Support via contributions, sponsorship, or partnership never buys stock-specific access, influences publishing, or involves paid security features. We are not a registered charity.

Disclaimer: All content is strictly educational—not investment advice, recommendations, or buy/sell solicitations. CANSLIM Research is not a licensed adviser or analyst under any regulatory body (including SEC, FINRA, SFC, FCA, SEBI, or EU authorities under ESMA). Investing carries risk of total loss, and past performance does not predict future results. Consult a licensed financial adviser before investing.

Discover more from CANSLIM Research

Subscribe now to keep reading and get access to the full archive.

Continue reading