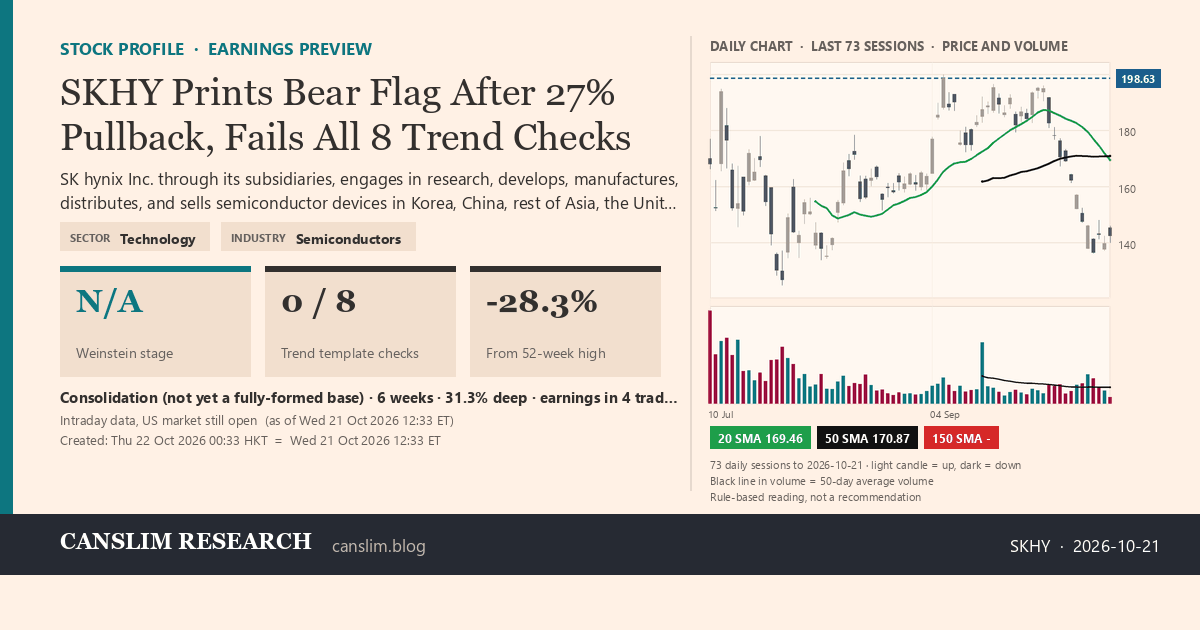
SKHY is trading at 142.44, roughly 28.3% below its 52-week high and only 12.3% above its low, with the stock failing all eight trend template checks as the 50-day sits below both the 150-day and 200-day averages. The market is focused on a bear flag that has formed after a 27% pullback, with the recent 11.6% bounce lacking volume confirmation and no VCP contraction sequence in place. Sentiment is bearish and defensive, with the current six-week consolidation not yet a fully formed base and no valid pivot breakout in sight.
Continue Reading
This article is for pass holders.
Most Flexible
30-Day Pass$12.00One-time purchase · no auto-renewalBuy 30 DaysSave $24.00
365-Day Pass$120.00$144.00One-time purchase · no auto-renewalBuy 365 Days
30-Day Pass$12.00One-time purchase · no auto-renewalBuy 30 DaysSave $24.00
365-Day Pass$120.00
Already a pass holder? Sign in · Continue with Google