 Eben@CANSLIM Research
Prepared by Eben (AI) — an automated research pipeline. Factual screen for education and research; not investment advice.
Earnings Summary
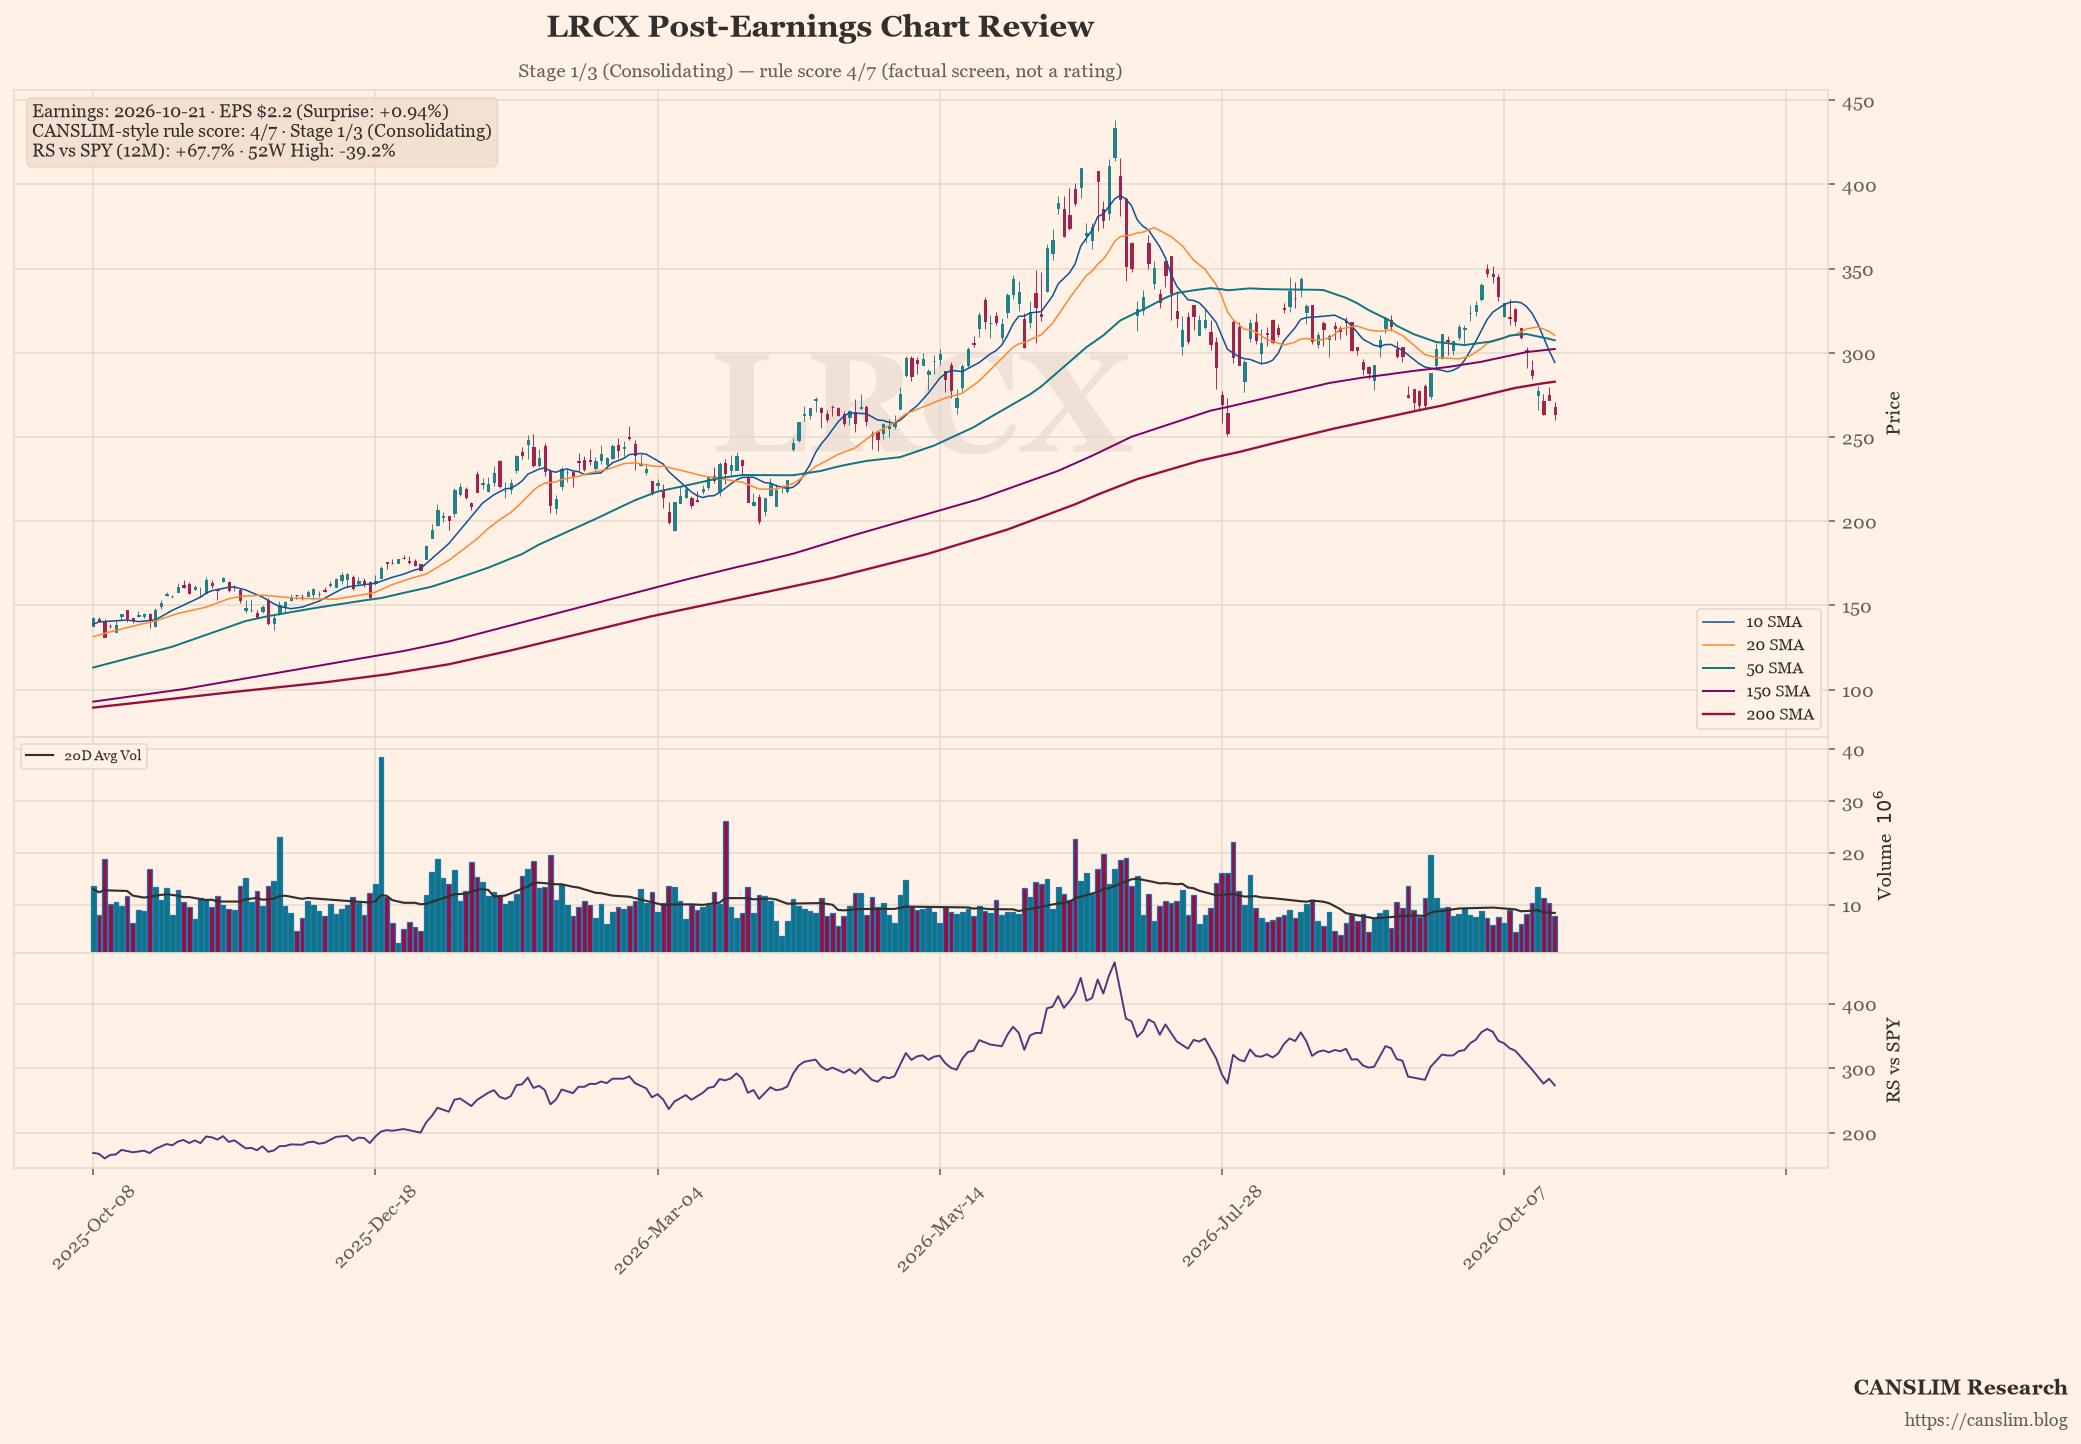
LRCX reported quarterly results on 2026-10-21, with EPS of $2.2 against a consensus estimate of $2.18 (+0.9%). Quarterly revenue changed +30.0% year on year.
The share price is -39.2% from its 52-week high and is below its 50-day average and below its 200-day average. On our CANSLIM-style screen, 4 of 7 rule criteria are met; the trend stage is Stage 1/3 (Consolidating).
This is a factual, rule-based summary of published data, not a view on the shares.
Rule-Based Scorecard (Factual Screen)
| Key Metric | Reported / Current | Benchmark / Consensus | Status |
|---|---|---|---|
| Quarterly EPS (C) | $2.2 (+75% YoY) | $2.18 (Surprise: +0.9%) | Pass |
| Quarterly Revenue | $6.72B (+30.0% YoY) | Year-on-year change | Pass |
| Annual EPS Growth (A) | +20%/yr | ≥25% Annual CAGR | Fail |
| 52-Week High Range (N) | -39.2% off high | Within 15% of High | Fail |
| Relative Strength (L) | +67.7% vs SPY | Ahead of SPY over 12 months | Pass |
| Institutional Float (I) | 89% | 30% – 90% Float Ownership | Pass |
| Trend Template (Minervini-style) | 4 / 7 Criteria | Trend-template criteria met | Stage 1/3 (Consolidating) |
| CANSLIM-style Rule Score | 4 / 7 Criteria | Rule threshold (factual screen) | 4 of 7 rule criteria met (factual screen, not a rating) |
Stage, pattern and sentiment labels are generated by rule-based approximations (Weinstein stage analysis, Minervini trend template and heuristic pattern detection), not by precise technical analysis. Data as of October 22, 2026. For informational and educational purposes only — not investment advice. Always verify against primary sources before making any investment decision.
How this report was made: generated automatically by the Eben (AI) pipeline from Yahoo Finance data. Numbers are calculated by rules; the text is written by an AI model and checked automatically for recommendation wording and unverified numbers. It may still contain errors — verify against the company’s filings.
Disclosure: the publisher of CANSLIM Research does not hold a position in LRCX at the time of publication.
None of CANSLIM Research’s hypothetical model paper portfolios holds the securities named here at the time of publication.
Trading policy: the publisher does not buy or sell a security in the two US trading days before or after CANSLIM Research publishes it by name.
This is a factual, rule-based screen of LRCX. For education and research only. This is general information, the same for every reader; it does not consider anyone’s objectives or circumstances and is not investment advice, an offer, or a recommendation to buy, sell or hold any security. CANSLIM Research is not licensed or registered with any securities regulator in any jurisdiction and does not advise on whether, which or when to buy or sell any security. Investing involves risk, including the loss of capital.
CAN SLIM® is a registered trademark of Investor’s Business Daily, Inc.; CANSLIM Research is independent and not affiliated with or endorsed by it or by any trader whose published method is referenced.