Andrew
General educational commentary only, generated automatically with AI. Not investment advice or a recommendation to buy, sell or hold any security. Capital is at risk.
Inflation Report Pushes Stocks Lower and Yields Higher
A hotter-than-expected September inflation report weighed on U.S. stocks, according to the news brief. The Wall Street Journal reported that stocks fell on the data. September CPI rose 3.7% from a year earlier, up from 3.4% in August. Monthly inflation climbed 0.6%, a five-month high. Core CPI, which excludes food and energy, rose 0.3%, above the 0.2% forecast. Reuters reported that Fed's Goolsbee called the data discouraging. Higher energy costs drove much of the increase, but the firm core reading suggests pressure may not be limited to fuel.
Rate-Sensitive Growth and AI Shares under Pressure
Higher Treasury yields and rising odds of a Fed rate hike pressured equities, especially rate-sensitive growth stocks, per the brief. Reuters described a "red hot CPI report" that fueled an AI rout. AI infrastructure and chip shares weakened as investors weighed higher financing costs against questions about revenue and debt. Banks faced mixed signals. Reuters reported that bond-market volatility weighed on trading results, even as AI-related activity supported some Wall Street businesses.
Online Sentiment Turns Fearful on AI Credit and Rate Path
Online sentiment comes from unverified posts by anonymous retail users. It may include rumour or speculation and has not been checked. According to that report, the mood tilted toward fear, near 25/100 on a fear-greed measure. Posts focused on AI infrastructure credit risk. One theme involved unsecured bonds of a data-center company trading below 80% of par, with yields above 15%. The community also debated why yields fell despite hot CPI. Some posts called it a stagflation signal. Others said it reflected money moving to bonds. Many accounts described late-session bounces as bull traps. The report noted that some retail users still bought short-dated calls late in the session. That suggests sentiment had not fully capitulated. One reading is that anonymous posts amplify fear faster than facts. This may suggest headline-driven mood swings, not confirmed positioning.
Indexes Diverge as Semiconductors and Small Caps Weaken
The social sentiment report said SPY stood at 768.95 (-1.17%) and QQQ at 728.86 (-1.99%) as of 15:44 ET. IWM fell 2.15%, while DIA fell only 0.23%, supported by healthcare stocks. The Philadelphia Semiconductor Index had fallen nearly 12% since the prior Tuesday. The 10-year yield briefly surged above 5.32%, then retreated to around 5.19%. The report said TLT was up 0.63%. These figures come from the third-party summary and may be incomplete or wrong.
Chart Screen Flags Weakness in the Dow Jones Industrial Average
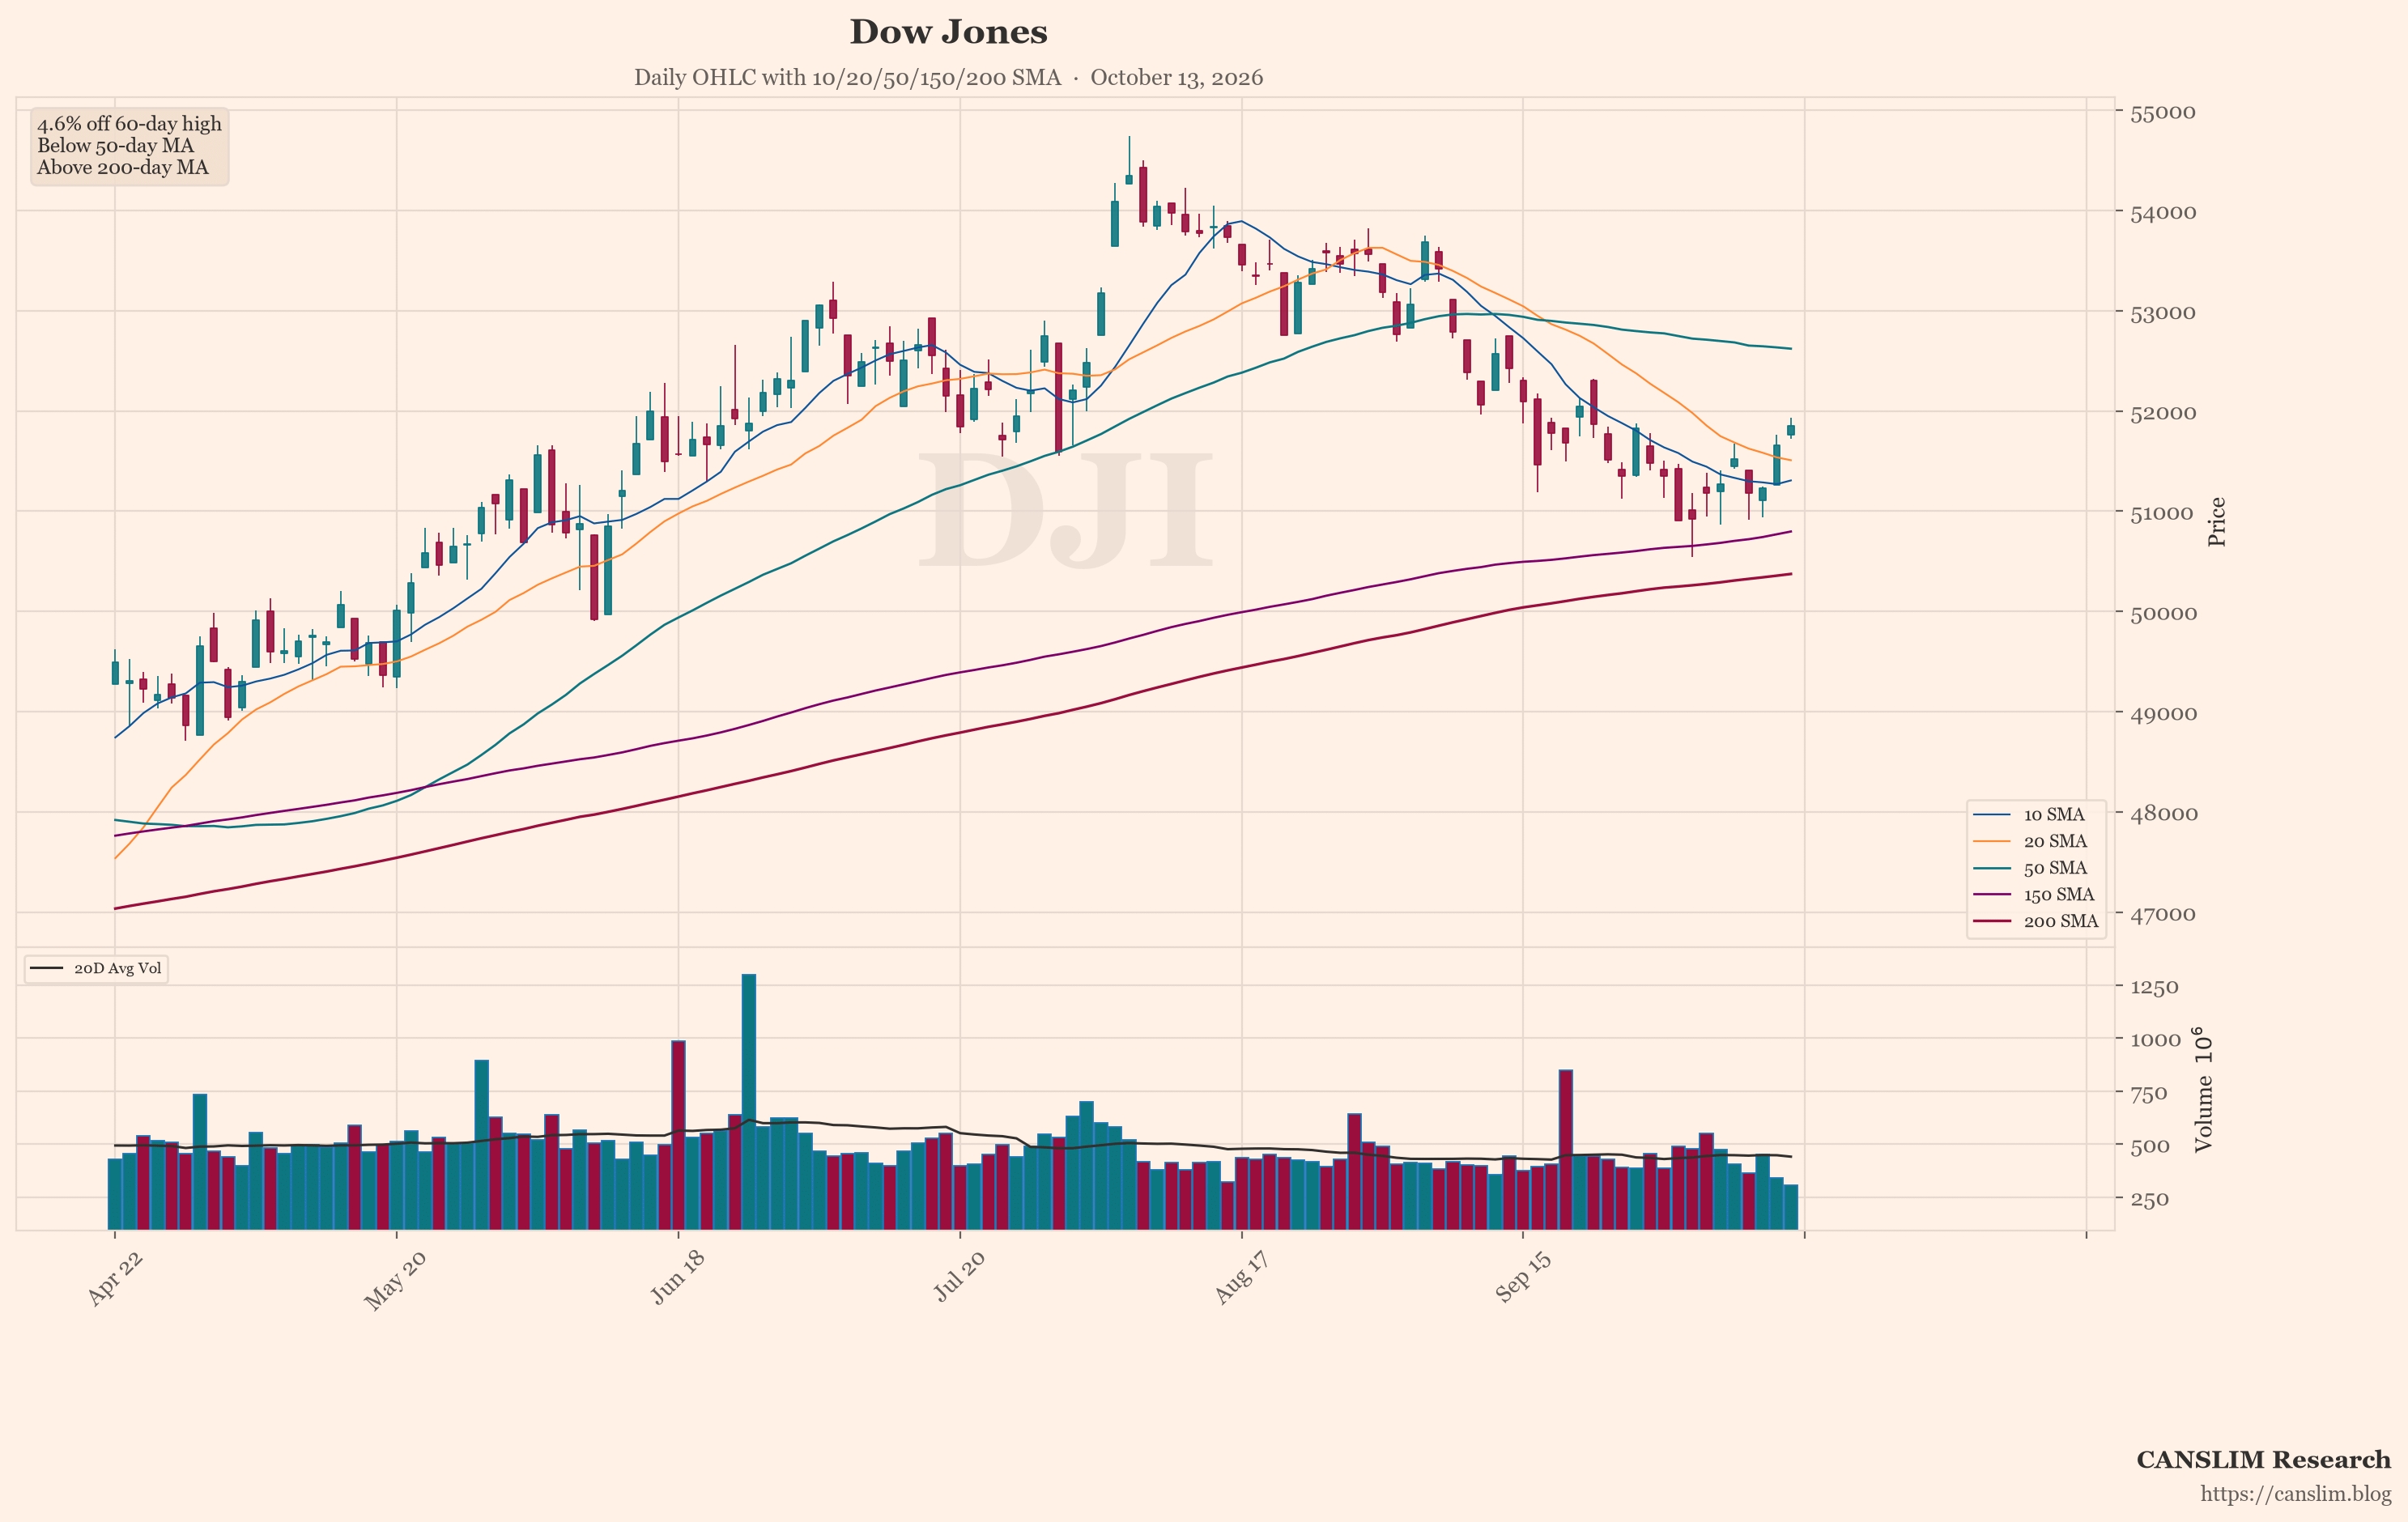
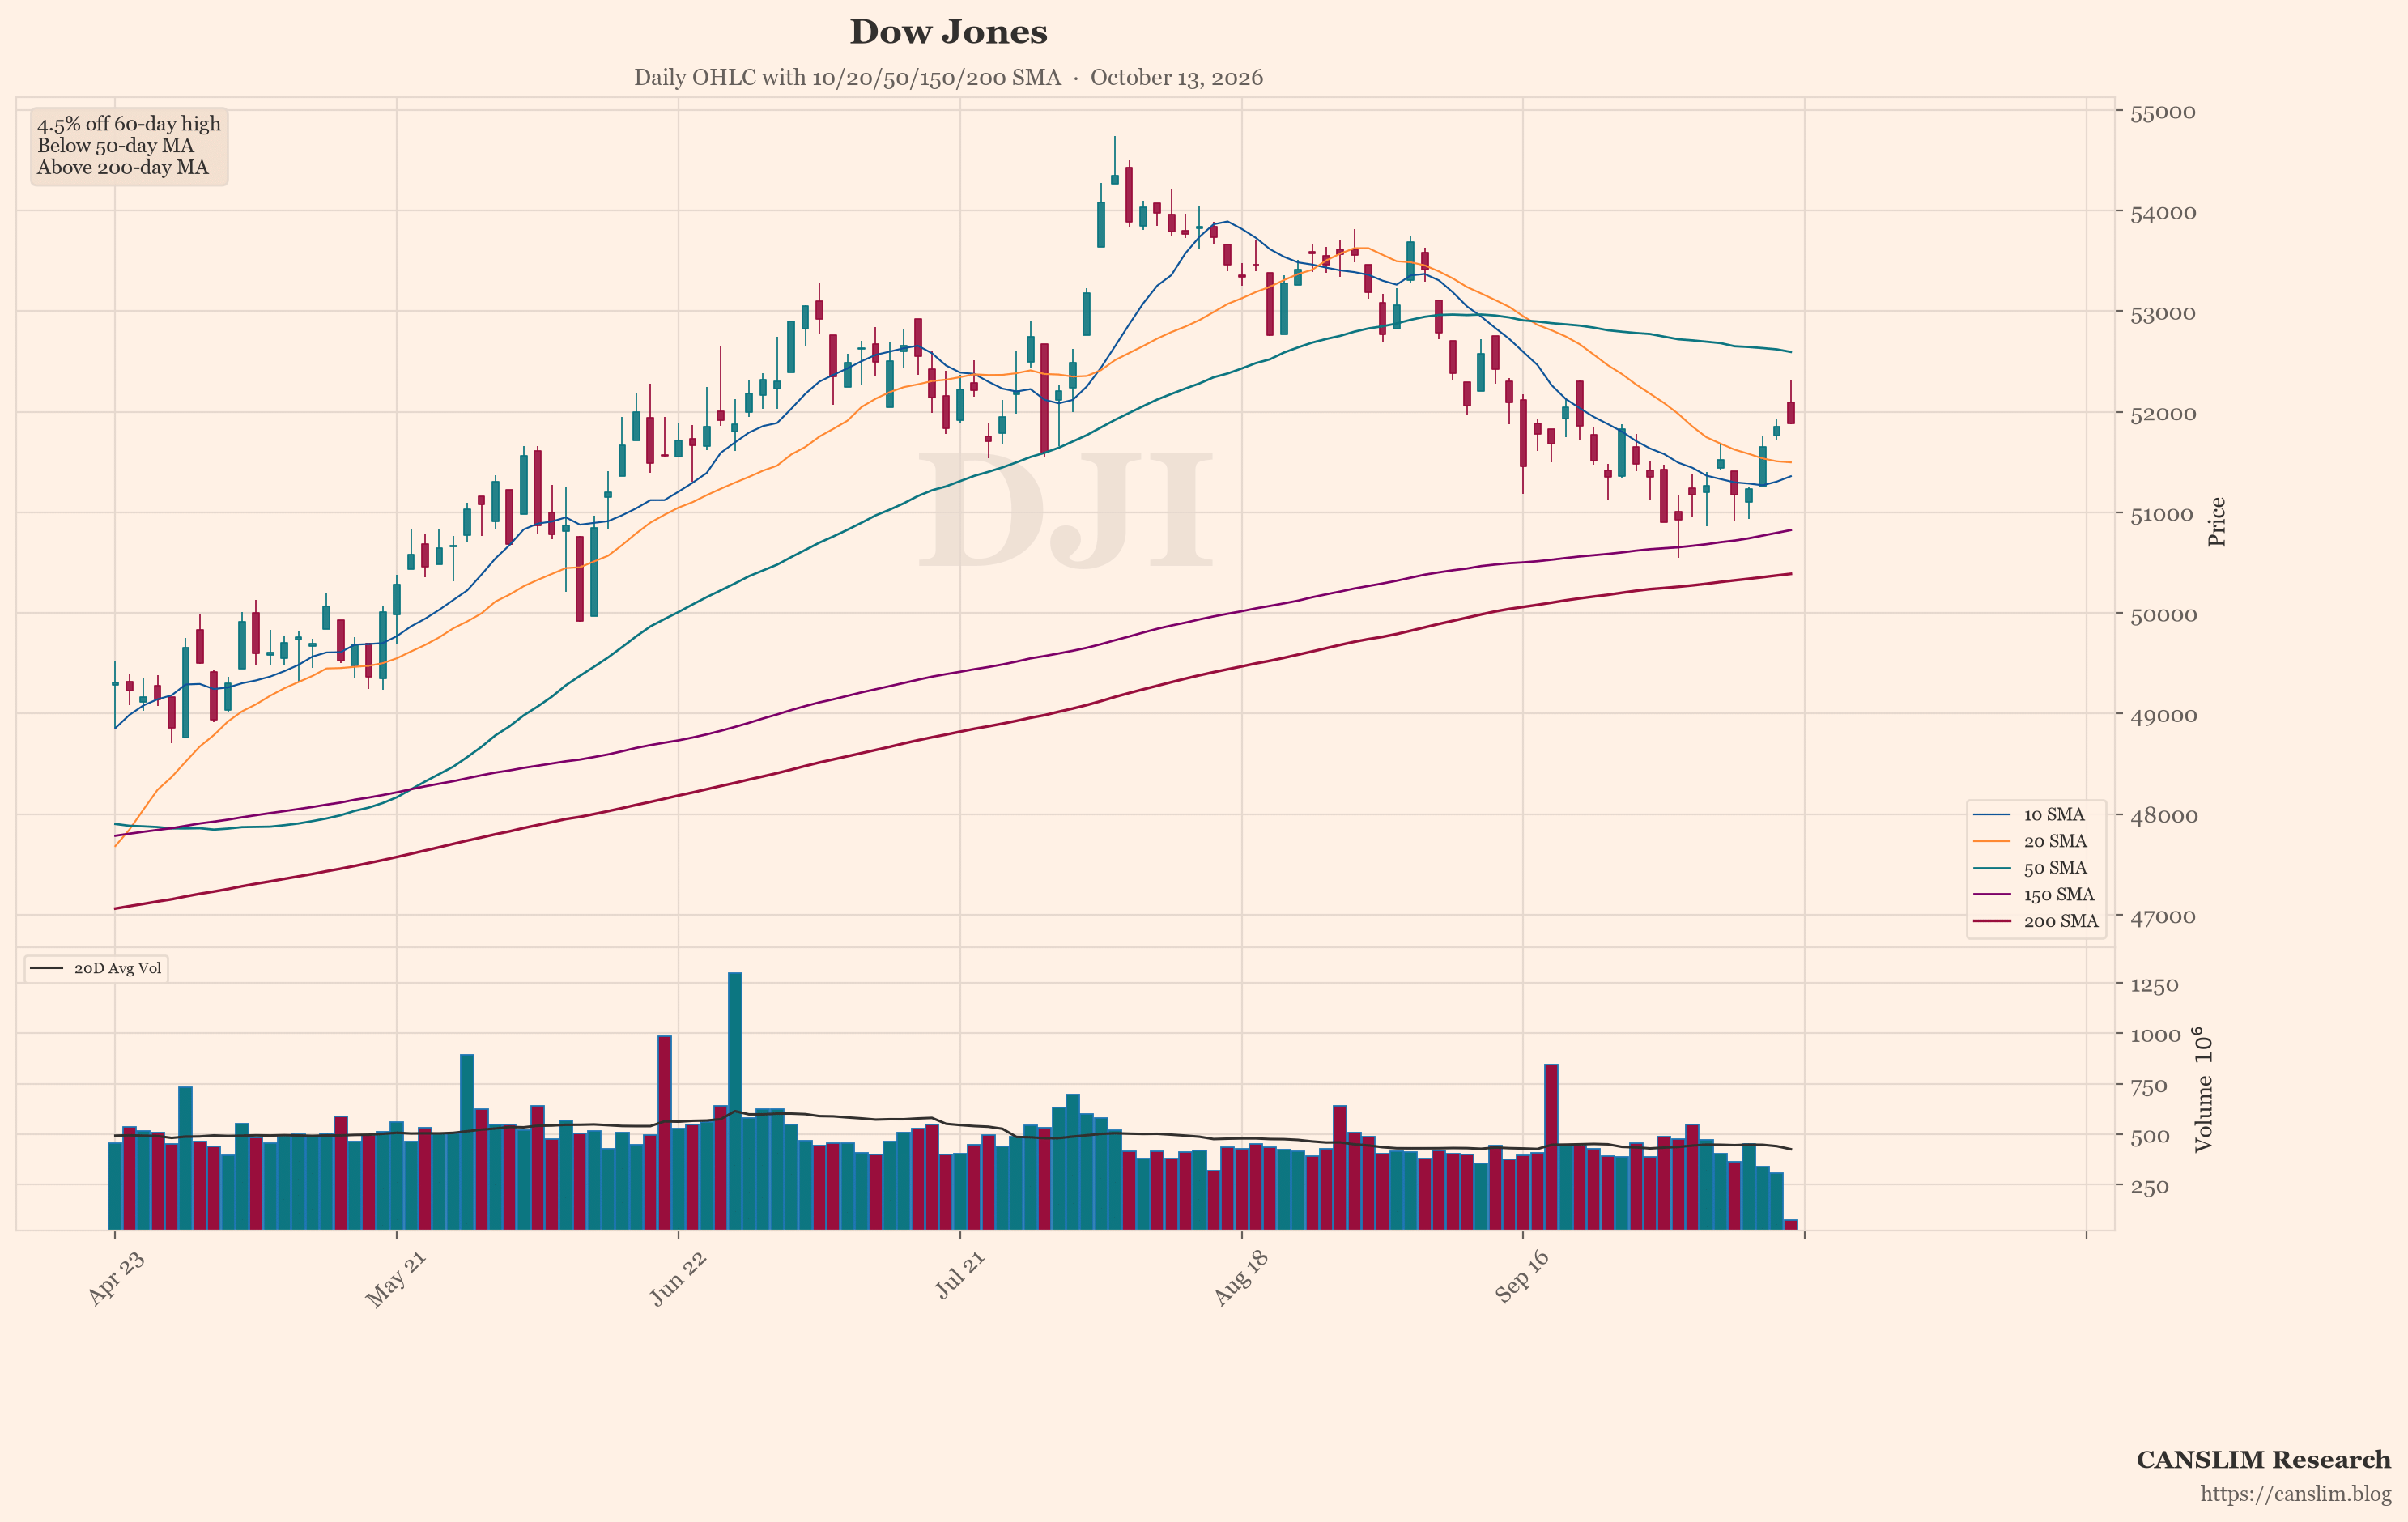
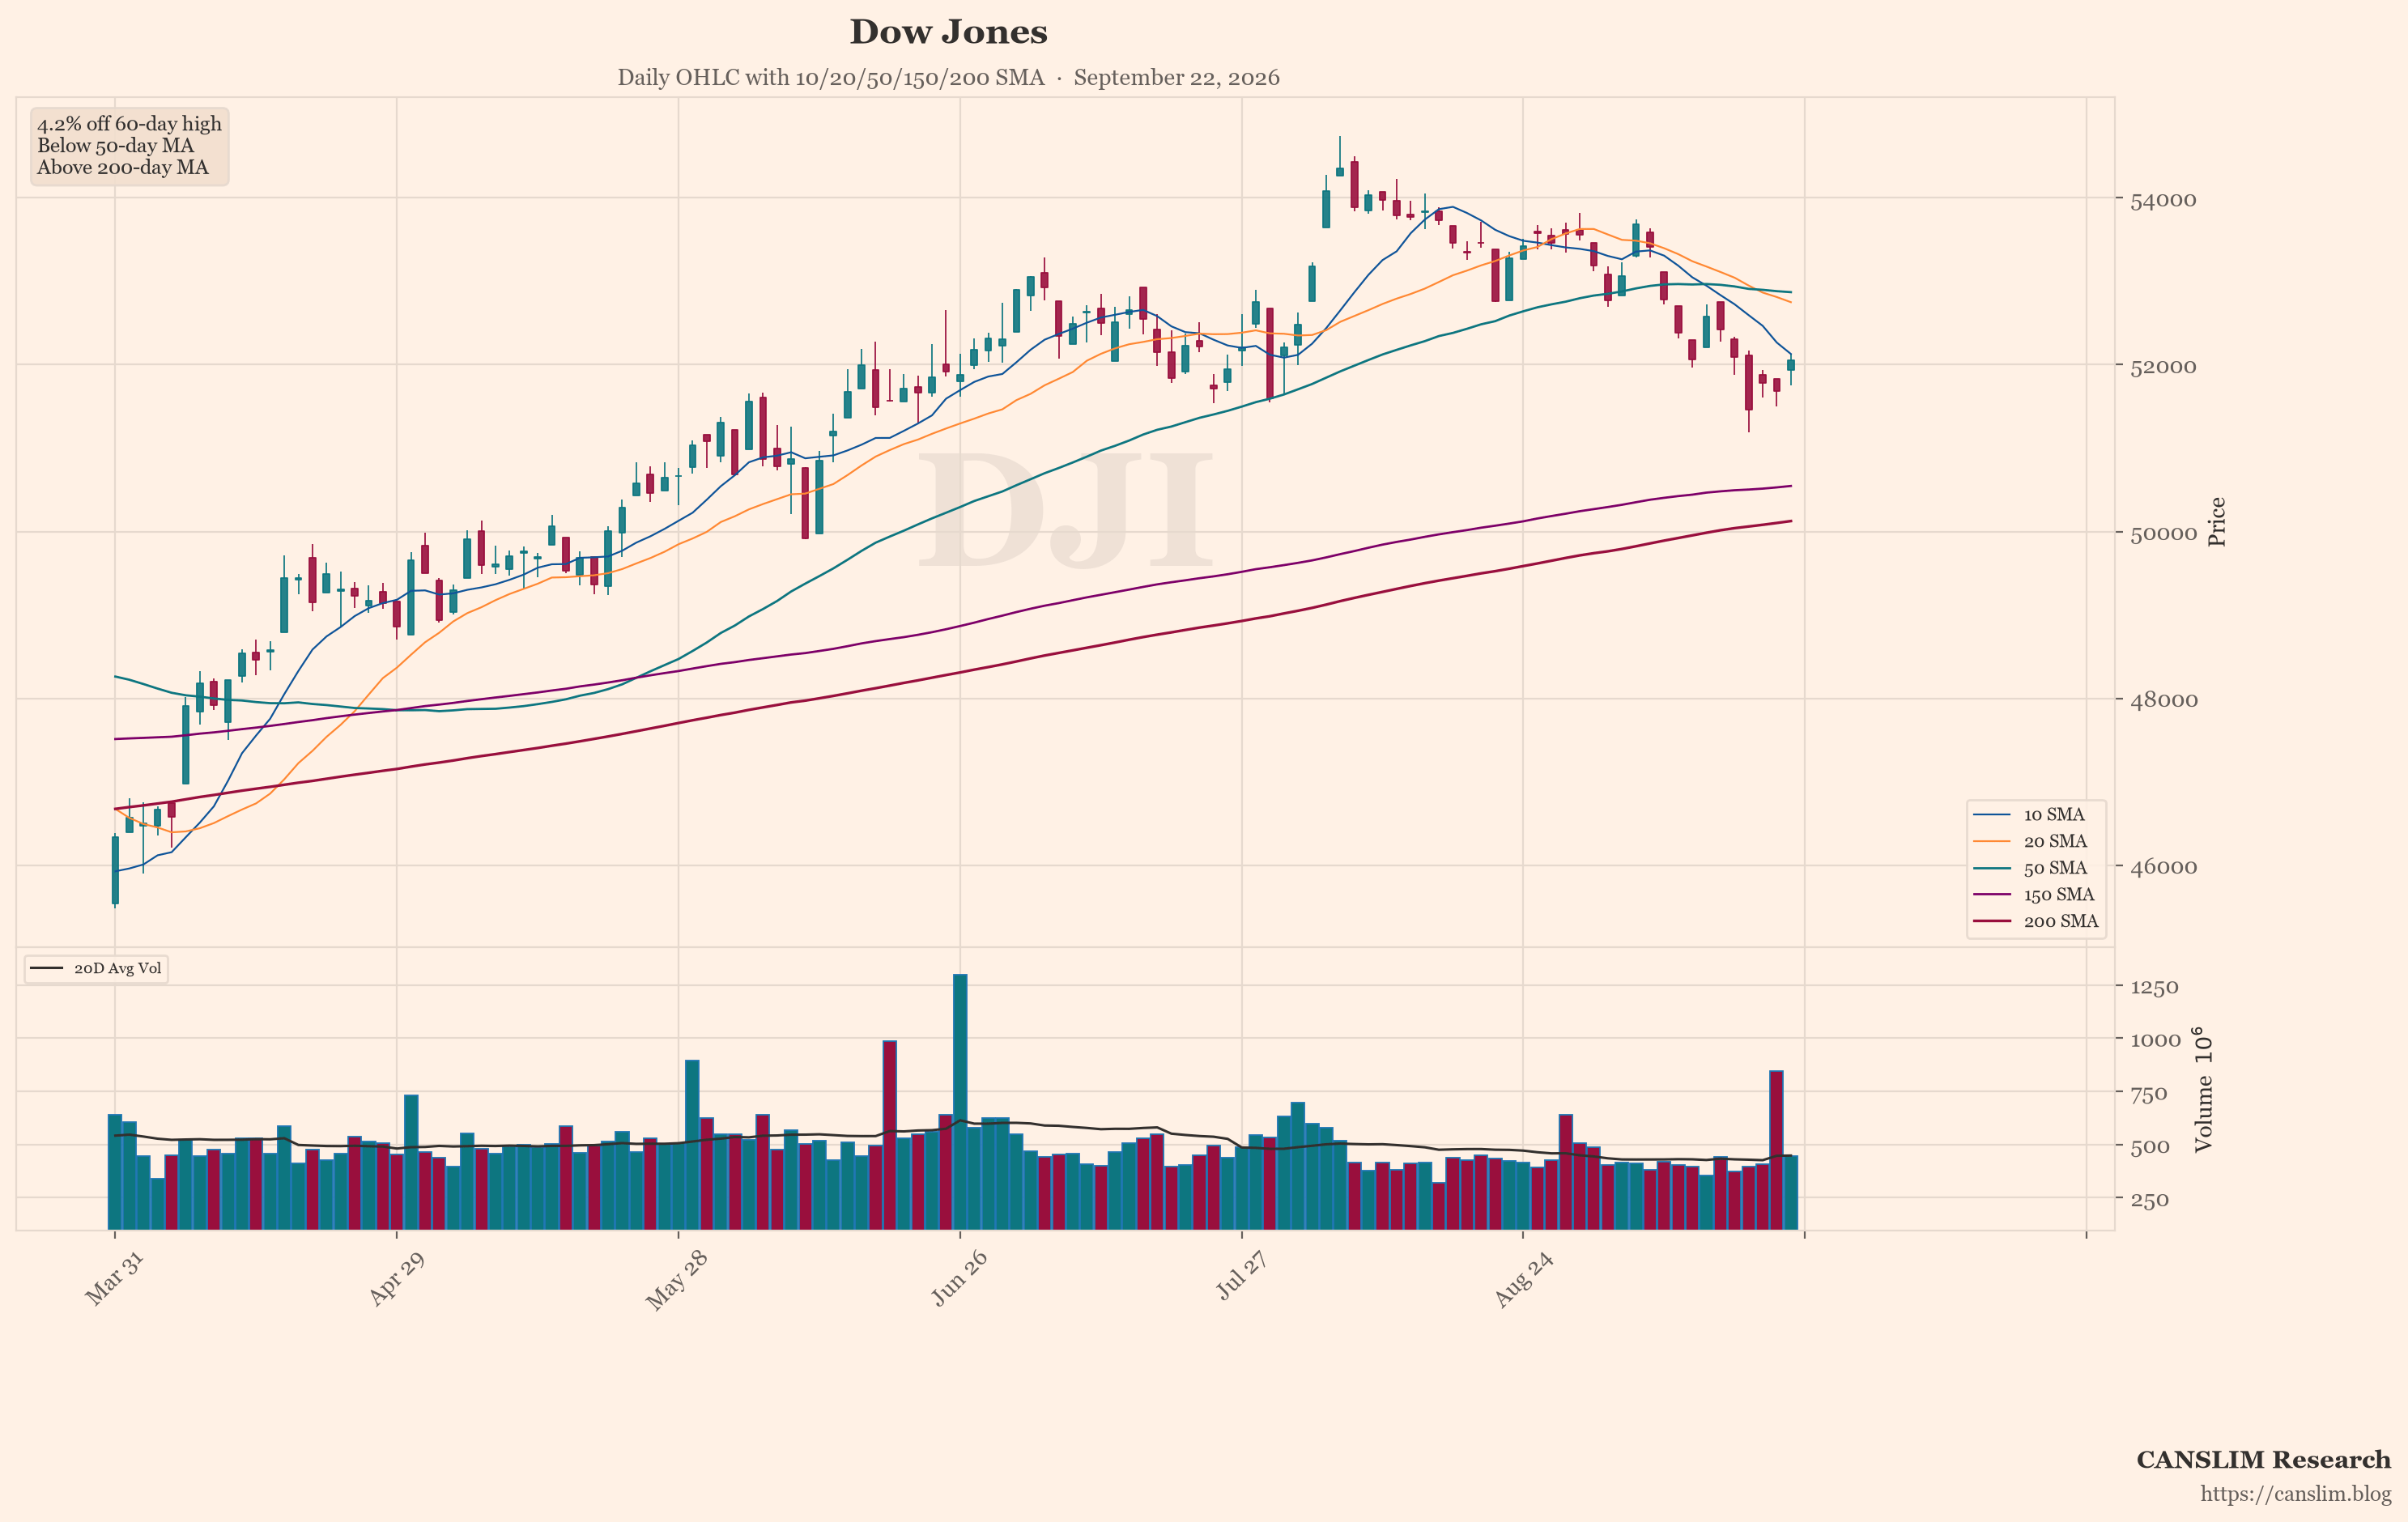
The featured chart shows Dow Jones (^DJI). An automated technical screen picked it because, among the indices and stocks it checked, it showed the most weakness on a few measures: distance from its recent high, position versus its 50-day and 200-day moving averages, and down days on higher volume. This is a factual note on what the screen measured. One screen is not a full view. Past price patterns do not predict future results. The screen is not a signal to act.
Earnings and Fed Meeting Remain Key Uncertainties
The brief said investors are focused on whether the Fed will raise rates at its next meeting. Market expectations for a hike rose sharply, but economists remain split, per MarketWatch. The brief listed further clues to watch: energy and diesel costs, incoming inflation data, and bank and technology earnings. Those will help show whether September was a temporary energy-driven flare-up or a broader challenge to expectations for easier policy. The social report mentioned pending PPI and retail sales data, plus TSMC earnings. It also noted a pre-IPO investor day for Anthropic. Risks cut both ways. If energy prices ease, inflation pressure could fade. If core inflation stays firm, rate expectations could rise further. AI infrastructure firms face questions about debt and revenue. Banks face rate volatility. The path of yields, earnings and Fed policy remains uncertain. Conditions look mixed, with weak breadth in some areas and resilience in others.
Sources: a third-party AI-generated market news summary, and an AI summary of unverified posts by anonymous retail users online. This article was written by an AI language model from those summaries and published automatically without human review. Updated 2026-10-15 06:00 HKT.
CANSLIM Research (canslim.blog) is an independent educational publisher. It is not licensed or registered as a broker, investment adviser, research analyst or asset manager in any jurisdiction. This article is general information for education only. It is not investment advice, a research report, an investment recommendation, or an offer or solicitation to buy or sell any security, and it does not consider any reader's objectives, financial situation or needs. No ticker, chart, heading or technical comment is a suggestion to buy, sell, hold or short. Figures come from third-party sources, are not independently verified, and may be incomplete, out of date or wrong. Online sentiment may include rumour, speculation or coordinated posting. Past performance and past price patterns do not predict future results. Investing involves risk, including the loss of capital. This article is not updated after publication. Laws differ by country; seek advice from a licensed professional in your jurisdiction before making any investment decision.
Discover more from CANSLIM Research
Subscribe to get the latest posts sent to your email.