Andrew
General educational commentary only, generated automatically with AI. Not investment advice or a recommendation to buy, sell or hold any security. Capital is at risk.
Dow Falls 341 Points as Treasury Yields Reach Multidecade Highs
Stocks fell on Wednesday. The Dow Jones Industrial Average dropped 341 points, according to the market brief. Major indexes ended their October winning streaks. They stayed near record highs.
The Wall Street Journal reported that Treasury yields climbed to their highest levels in decades. That revived concern about another Federal Reserve rate increase this year.
Fed Minutes Show Unanimous Support for September Hike
CNBC reported on the Fed minutes. All 19 officials backed September's rate increase. Many saw another hike as appropriate if inflation stays elevated.
The minutes did not signal a rush to raise rates again. The timing of any further move remains uncertain. Attention stays on upcoming inflation data and how long borrowing costs stay high.
Technology Leads While Most Stocks Sit below Key Averages
Leadership is narrow. Technology has been the market's main source of strength. It was the only S&P 500 sector to gain since September, per the brief. Only 46% of S&P 500 stocks are above their 200-day average. Banks have lagged.
Seeking Alpha noted that tech now faces a rate test. MarketWatch described rising yields pressuring earlier winners. One reading is that narrow leadership may leave the market more vulnerable if high yields weigh on tech valuations too. This is interpretation, not a reported fact.
Oil and Geopolitical Risks Add Uncertainty to the Outlook
CNBC reported that the U.S.-Iran conflict could intensify. The outlet also said the U.S. is reportedly preparing for "massive bombing," while Trump said he is not keen on a deal with Iran. A Gulf hurricane threatens energy supply, per Schwab Network. CNBC reported a supertanker chartered from the Gulf Coast to China for $76 million, ten times higher than pre-war levels.
These events could keep oil prices and inflation volatile. That may complicate the Fed outlook.
Online Sentiment Shows Frustrated Bullishness as Breadth Weakens
Online sentiment comes from unverified posts by anonymous retail users. It may include rumour or speculation and has not been checked. It is not confirmed positioning.
The overall mood leaned toward greed, near 62/100 on a fear-greed measure cited in the social report. Many posts mocked short positions and treated dip-buying as the default. At the same time, posts about losing streaks and losses such as 25,000 this week became more frequent. The report called the mood "exhausted greed."
The community called Wednesday a "bear-trap day." But SPY closed down 0.25% and IWM fell 1.29%. A claim circulated that about 75% of NYSE stocks closed red. That claim is unverified. The gap between the bullish narrative and weak breadth is worth noting.
Theme-level chatter focused on index pinning near 7800 on the S&P 500 and a quiet final hour. Some users said low volume let market makers collect from both sides of same-day options. Others debated whether the Fed minutes were already priced in. Memory-related themes drew attention after a strong session in that group. Neocloud-related themes weakened ahead of earnings. None of this is confirmed flow or institutional activity.
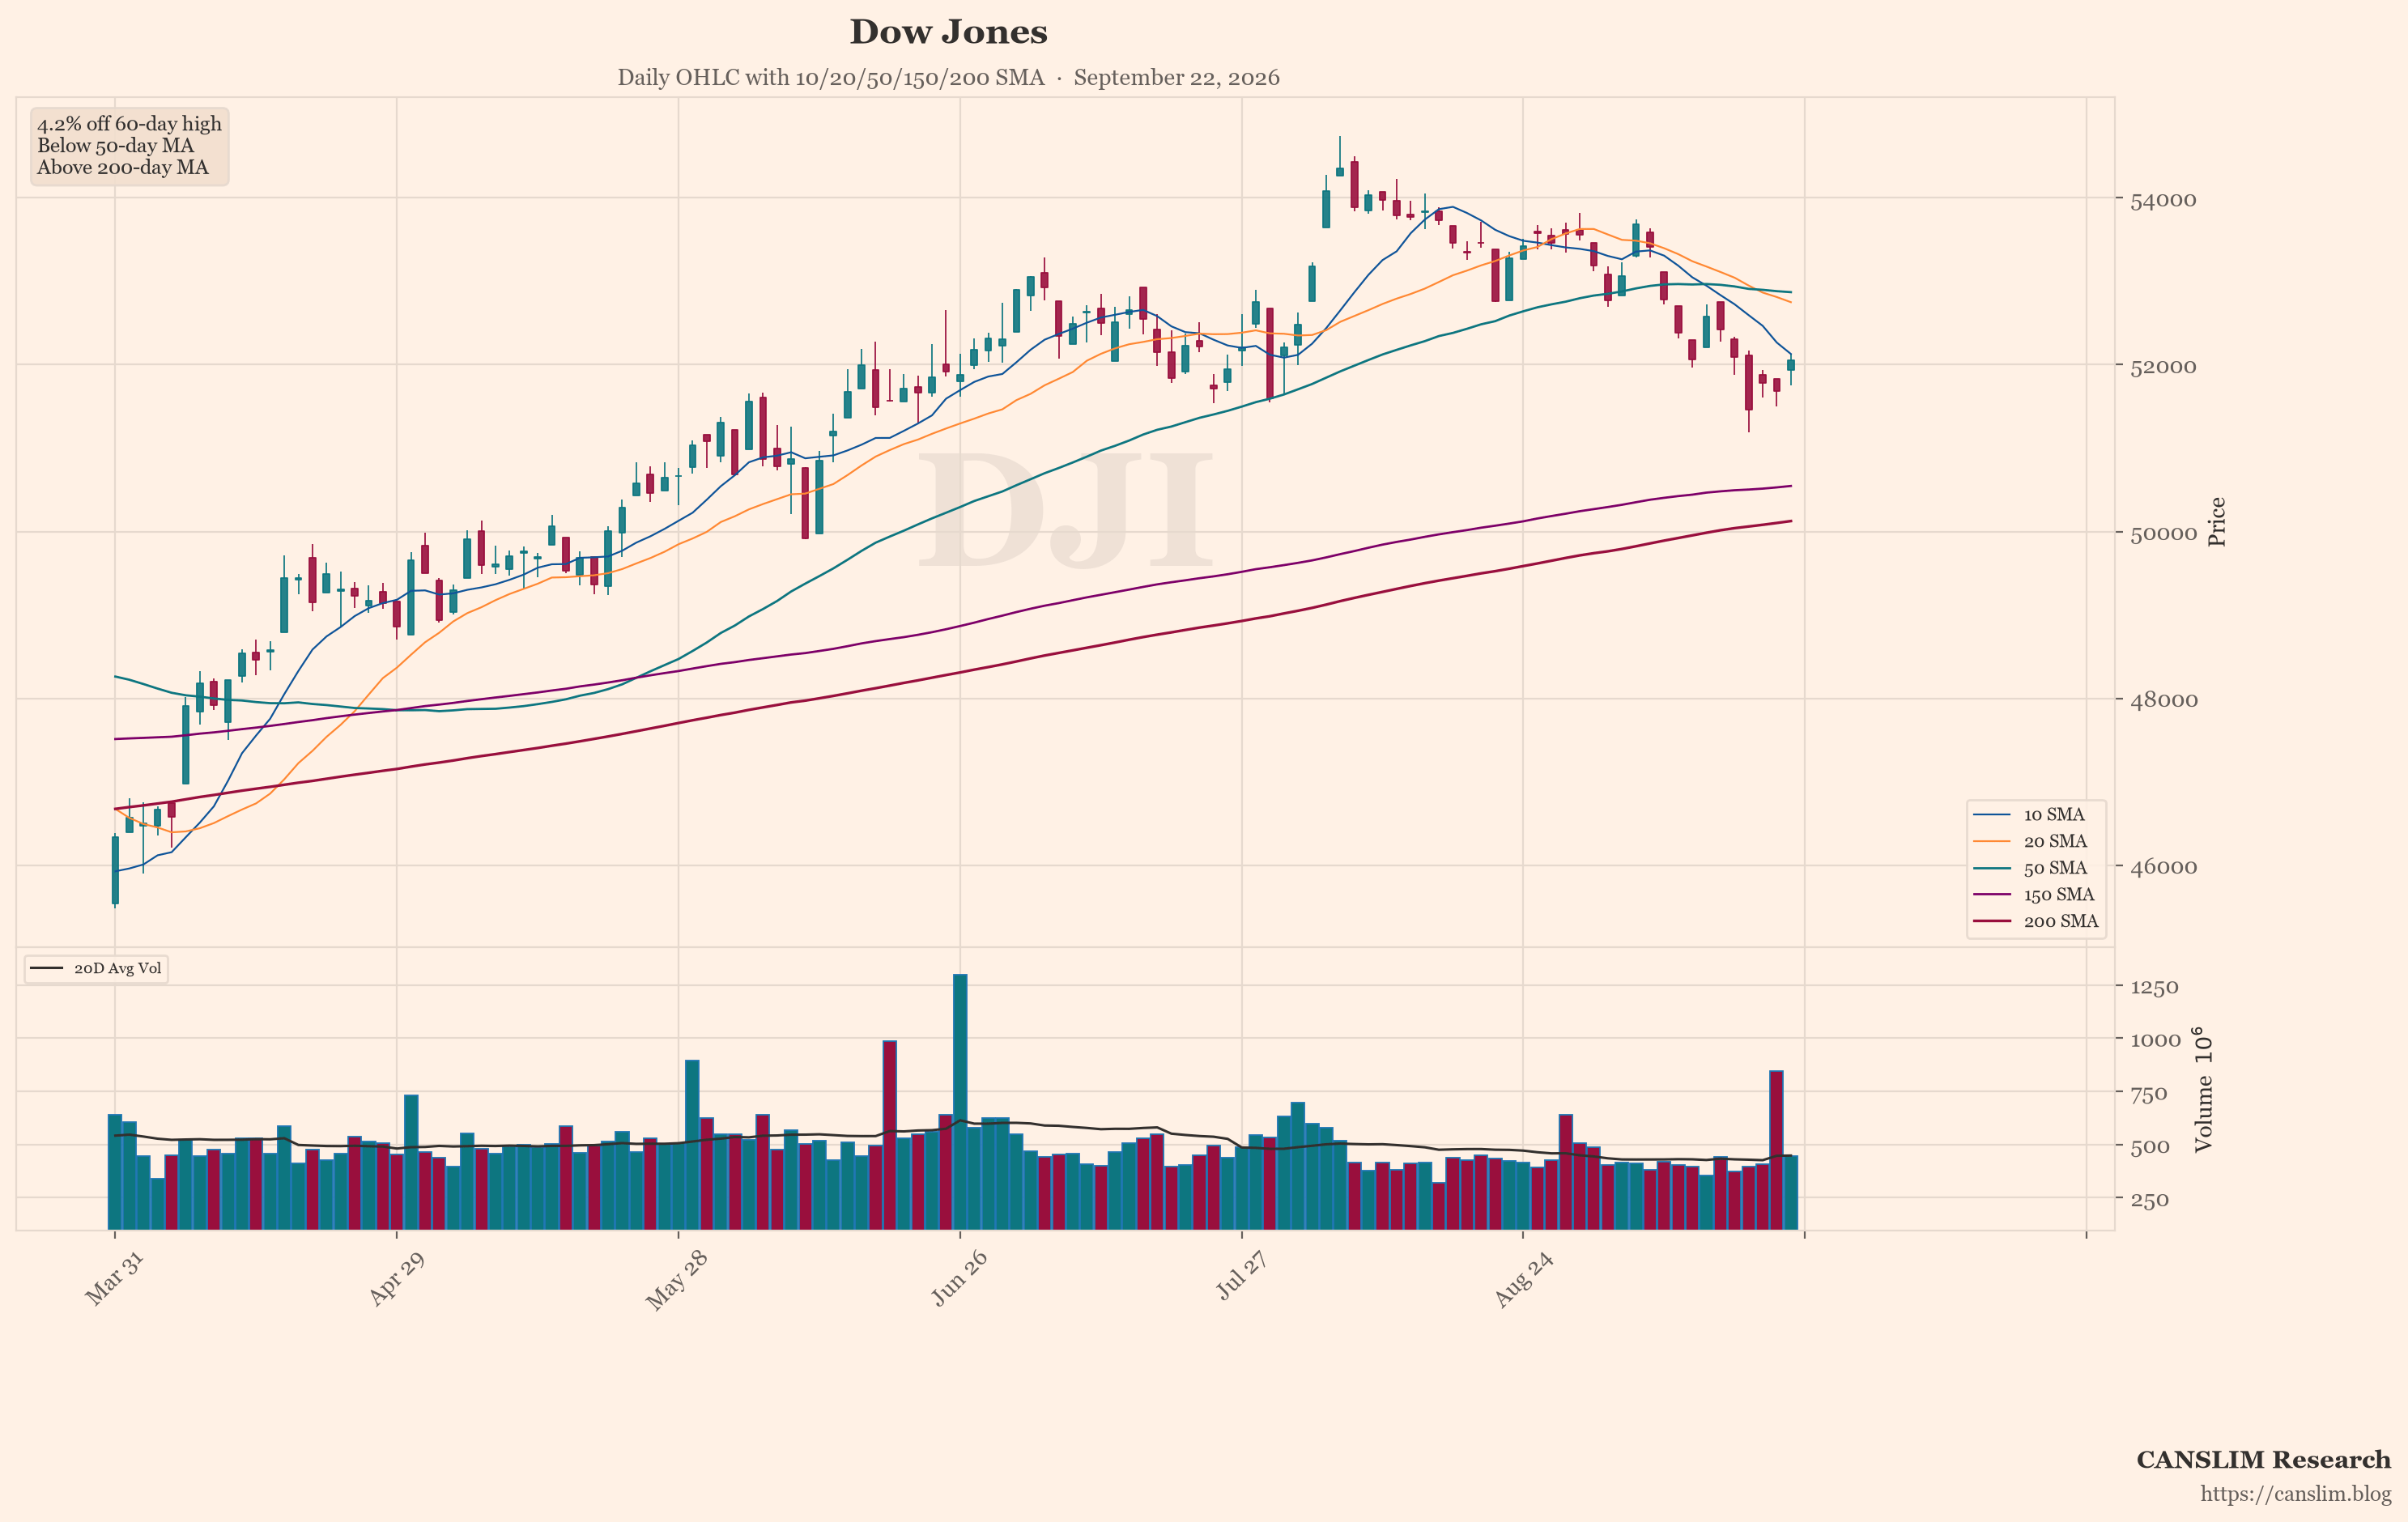
Chart Screen Flags Dow Weakness on Several Measures
The featured chart shows the Dow Jones (^DJI). An automated technical screen picked it because, among the items checked, it showed the most weakness on a few measures. These include distance from its recent high, position versus its 50-day and 200-day moving averages, and down days on higher volume. One screen is not a full view. Past price patterns do not predict future results.
Conditions Remain Mixed as Yields and Breadth Compete with Record Levels
The market sits in a mixed place. Indexes remain near records. Yields are high. Breadth is narrow. Tech carries much of the leadership. Banks and rate-sensitive areas have lagged. Oil and geopolitical risks add another layer of uncertainty.
The Fed's next steps depend on inflation data. The timing of any further hike is unclear. Online sentiment leans bullish but shows signs of fatigue. Risks include a broadening of yield pressure into tech, weaker breadth, and energy-driven inflation swings. Conditions could change if any of these shift.
Sources: a third-party AI-generated market news summary, and an AI summary of unverified posts by anonymous retail users online. This article was written by an AI language model from those summaries and published automatically without human review. Updated 2026-10-08 14:00 HKT.
CANSLIM Research (canslim.blog) is an independent educational publisher. It is not licensed or registered as a broker, investment adviser, research analyst or asset manager in any jurisdiction. This article is general information for education only. It is not investment advice, a research report, an investment recommendation, or an offer or solicitation to buy or sell any security, and it does not consider any reader's objectives, financial situation or needs. No ticker, chart, heading or technical comment is a suggestion to buy, sell, hold or short. Figures come from third-party sources, are not independently verified, and may be incomplete, out of date or wrong. Online sentiment may include rumour, speculation or coordinated posting. Past performance and past price patterns do not predict future results. Investing involves risk, including the loss of capital. This article is not updated after publication. Laws differ by country; seek advice from a licensed professional in your jurisdiction before making any investment decision.
Discover more from CANSLIM Research
Subscribe to get the latest posts sent to your email.