Andrew@CANSLIM RESEARCH
Fed Delivers a Hawkish Surprise, Then Buyers Fight Back
The Federal Reserve raised rates by 25 basis points to 3.75%-4.00%. This was the first hike in over three years. The Dow dropped more than 600 points at first. But stocks turned higher Thursday. Treasury yields eased. Oil prices retreated. S&P 500 futures rose about 0.8% before the open. Nasdaq 100 futures gained nearly 1%. The message is clear: the market can absorb bad news when yields cooperate.
The Rate Hike Math That Growth Investors Must Respect
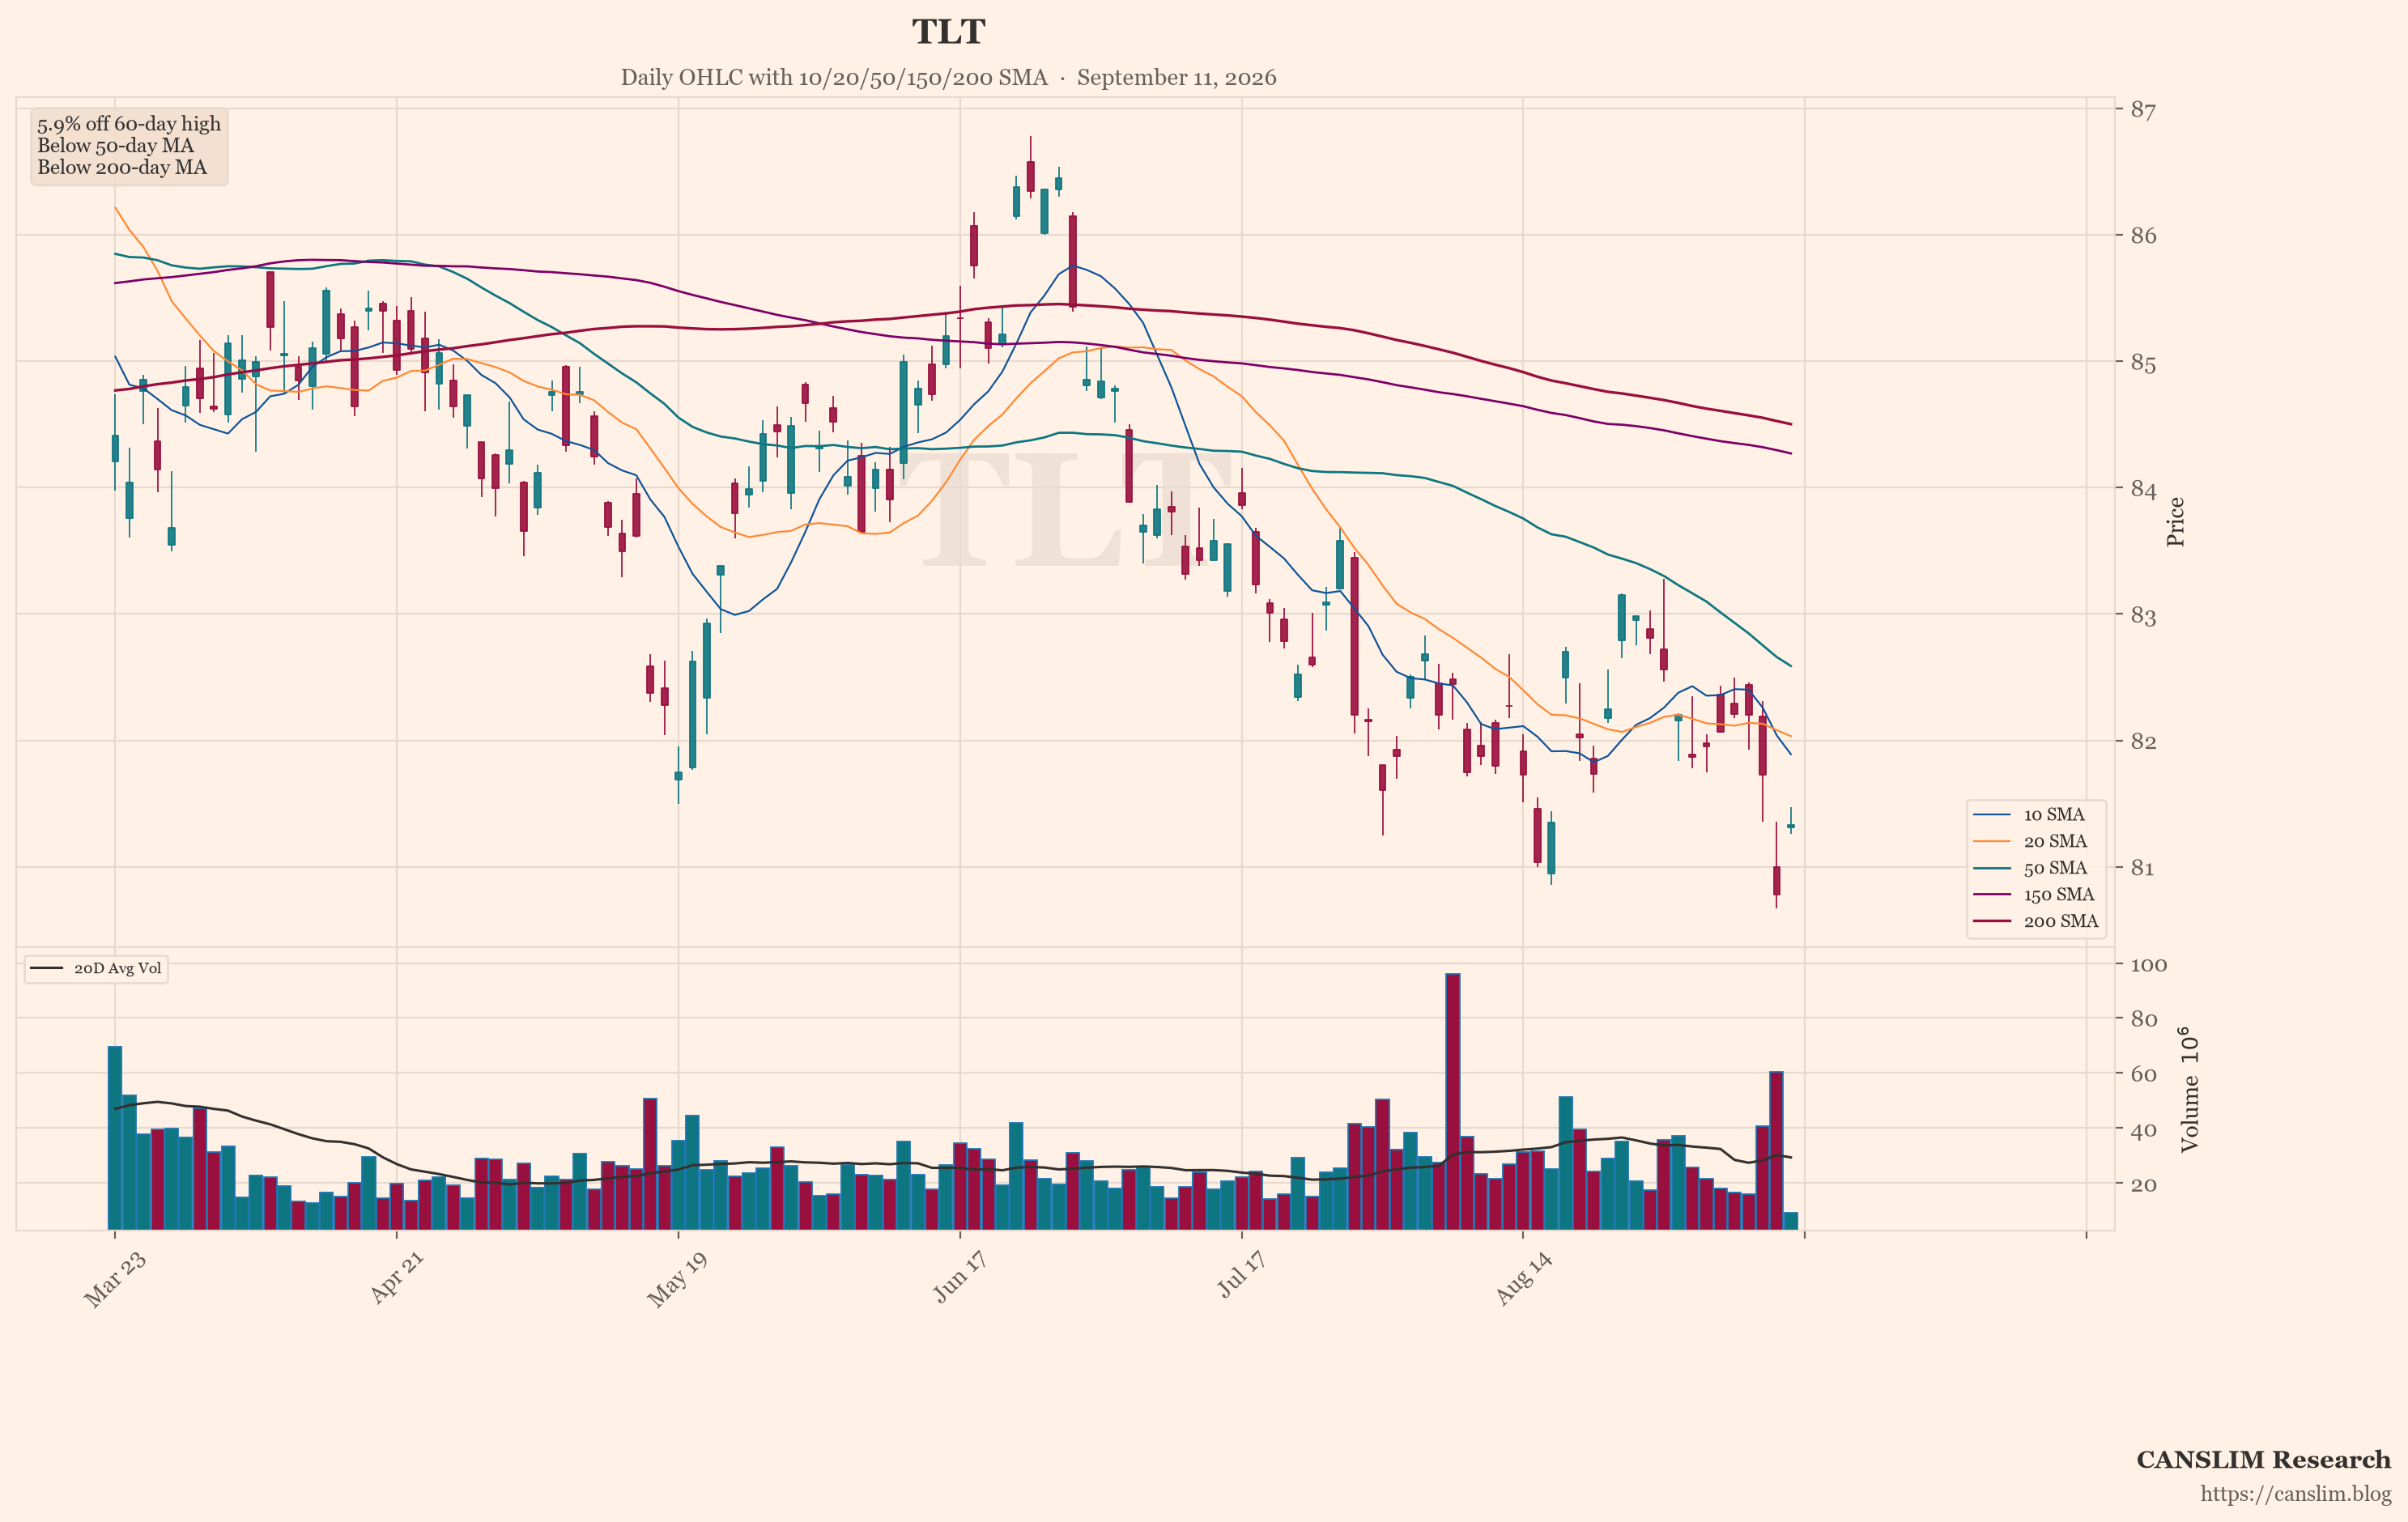
Higher rates hurt long-duration growth names the most. Investors now must discount a higher path for future rates. The dot plot showed 16 of 18 officials expect one more hike this year. That raises the hurdle for every growth stock. But falling yields and cheaper crude are helping the rebound. The next test is simple. Can long-term Treasury yields stay below 5%? Can oil keep falling? A reversal in either would challenge this bounce.
Compute Prices Soar While One Neocloud Drowns in Debt
Nebius announced big price increases across its GPU lineup. Effective 10/1, H100/H200/B200/B300 prices rise 17%-21%. The B300 goes to $9.50 per GPU-hour. EPYC CPU prices rise 25%. Memory prices jump 41%. NBIS traded at 228.64 pre-market, up 9.25%. SOXL rose 7.45%. NVDA added 1.67%. INTC gained another 3.11% to 104.16. This is the strongest theme in the cycle.
But CRWV tells a different story. CoreWeave announced $3 billion in convertible notes. The notes mature in 2033. There is an extra $500 million overallotment option. This is its third major debt raise in under a year. The crowd watched CRWV plunge from a sharp pre-market gain. One line spread fast: "all the neoclouds are green, while CRWV says wait for me to dilute one more time." Our featured chart, CRWV, now shows the weakest technical pattern in the group. Rising prices help peers. Dilution hurts CRWV.
Greed Hits 78 as the Online Crowd Celebrates Too Loudly
Global social sentiment is extremely euphoric. The fear/greed reading sits at 78/100. The "rate hikes are bullish" idea has become a slogan. Taunts like "bears are extinct" flood the discussion. Deep out-of-the-money 0DTE calls on SPY 765/770 are openly flaunted. Someone claimed to sell AMZN and move everything into NBIS. But sober doubt is everywhere too. Many warn "this pre-market move looks absurdly fake." Others say "it will definitely dump at the open." The mood is split: enjoy the rally, fear the reversal.
A Broad Rally That Is Not Broad at All
Sentiment and prices move together, but the size does not match. SPY is still roughly 2% below its all-time high. One popular note said it best: "We only pulled back 2%, yet you're acting like we just went through a 15% crash." The real problem is internal. Indices rise on the compute-pricing story. Yet CRWV is crushed by refinancing. FLNC collapsed 22% after cutting guidance again. HOOD fell 5.46%. The rally looks wide but dispersion is severe. Meanwhile, the crowd cheers that "oil has peaked." Diesel just hit a record $6.23 per gallon. That is the exact variable forcing the Fed to hike.
Where This Leaves the Growth Stock Playbook
Credit conditions matter more now. Borrowing costs are rising. Direct-lending funds show weaker credit quality and rising non-accruals. Energy remains the main inflation risk. Low European gas stocks and Hormuz disruption could spike LNG prices this winter. The policy mix is conflicted. Restrictive monetary policy faces supportive fiscal policy. That adds uncertainty. Corporate activity still looks healthy in spots. Revolut plans a New York-London dual listing. Apollo is exploring a sale of Energos above $3 billion. For now, watch yields, watch oil, and watch the leaders. Own strength, avoid dilution, and let the weakest chart, CRWV, remind you what happens when debt replaces momentum.
Sources: market news brief & global social sentiment data. Updated 2026-09-17 22:00 HKT. For educational purposes only — not investment advice.
Discover more from CANSLIM Research
Subscribe to get the latest posts sent to your email.