
 Mark Minervini
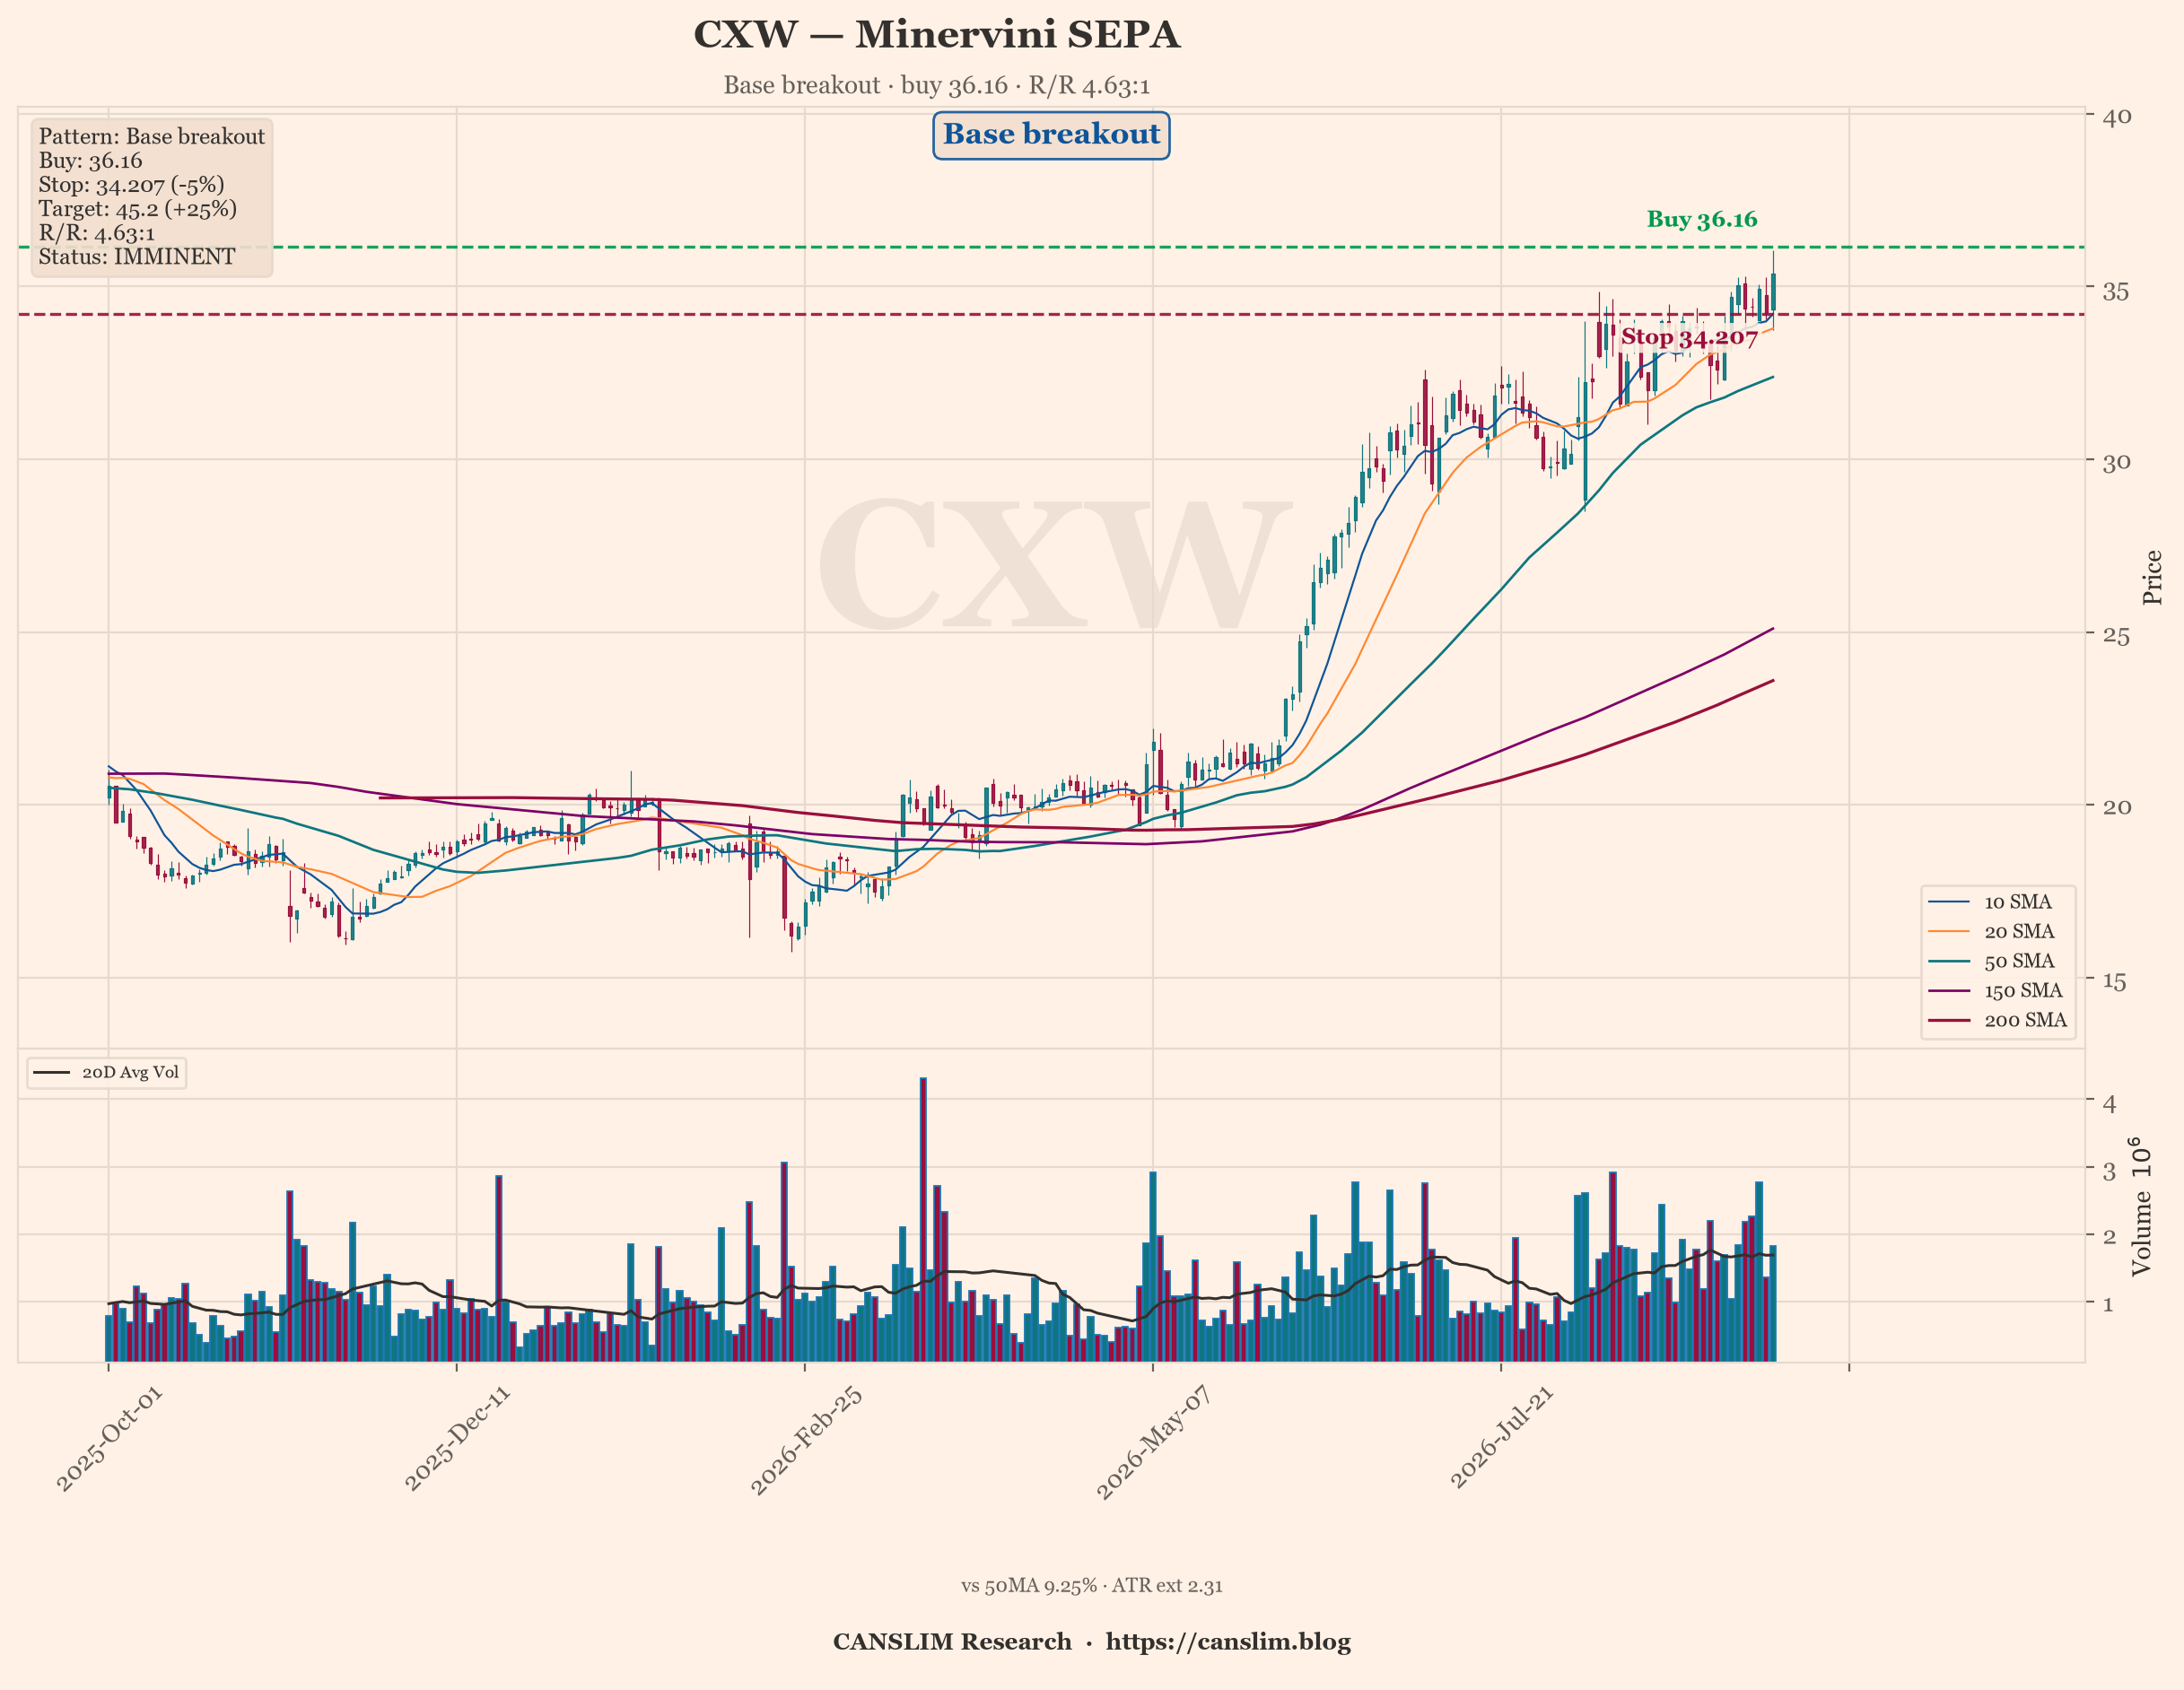
Market’s in a correction, so I’m not forcing anything. But CXW is showing me a clean base breakout with volume 23% above average and a 4.63-to-1 reward-to-risk — that’s the kind of asymmetry I’ll take even in a tough tape. Buy point is 36.16, and my stop goes right where it belongs, no negotiation. Seven actionable out of 348 tells you everything about this environment: cash is a position, and patience pays. I’d size this smaller than normal and let the market prove itself.
Disclaimer: The Mark Minervini AI Trader. Trained on Minervini’s SEPA methodology from Trade Like a Stock Market Wizard (2013) and Think & Trade Like a Champion (2017). This is a SEPA-inspired system.
· Educational Only: AI is prone to errors. All plans are for education.
· Static Logic: Autonomous self-improving logic permanently disabled.
The Trend Template Gate
Market: Market in Correction. Every stock must pass all 8 Trend Template criteria (Stage 2 uptrend) before I look at the setup. Today’s scan covers 8 deepvue scans merged and deduplicated.
| Rule | Threshold |
|---|---|
| Price > 150 & 200 MA | Stage 2 |
| MA stack 50>150>200 | Aligned |
| 200 MA rising | ≥1 month |
| 25%+ above 52w low | Confirmed |
| Within 25% of 52w high | Near high |
| RS Rating | ≥70 (80+ preferred) |
| Earnings | ≥20% YoY |
Today at a Glance
Scanned 348. Actionable 7 · Watch 6 · Avoid 335.
Portfolio Snapshot
Starting Capital: $100,000
Current Equity: $98,975 (-1.0%)
Cash: $80,229
Exposure: 19% · Positions: 6
Win Rate: 54% (26W / 22L)
Avg Win: +1.6% · Avg Loss: -2.3%
Max Drawdown: -12.7%
Recent Trades:
🟢 FRO +18.5% — Take-profit at $52.52 (+3.1R)
🔴 PBAM -0.1% — Suspected buyout pattern — sold, blacklisted
🟢 PBF +0.2% — Stop-loss hit at $73.66
🟢 UGA +6.9% — Suspected buyout pattern — sold, blacklisted
🔴 EC -2.6% — Portfolio risk trim (loser, -2.6%)
Open Positions
| Symbol | Shares | Entry | Current | P&L | Stop | Target | Days |
|---|---|---|---|---|---|---|---|
| MPC | 9 | $373.32 | $410.84 | +10.0% | $346.06 | $470.19 | 16 |
| VLO | 11 | $361.99 | $397.04 | +9.6% | $335.80 | $456.25 | 15 |
| FRO | 60 | $44.32 | $51.59 | +16.4% | $44.32 | $56.59 | 15 |
| DIG | 57 | $72.38 | $74.11 | +2.3% | $66.13 | $89.85 | 14 |
| EQNR | 57 | $45.23 | $45.75 | +1.1% | $42.79 | $56.36 | 7 |
| EC | 57 | $18.29 | $18.26 | -0.2% | $17.14 | $22.86 | 6 |
SEPA Setups — At or Near the Pivot
CXW · Base breakout · R/R 4.63:1

| Metric | Value |
|---|---|
| Buy Point | $36.16 |
| Stop | $34.207 (-5%) |
| Target | $45.2 (+25%) |
| R/R | 4.63 : 1 |
| Status | IMMINENT (-2.16% from buy) |
| Pattern | Base breakout |
| Sources | POWERPLAY |
Why now: CXW shows a Base breakout with buy point at 36.16. R/R 4.63:1 against a 34.207 stop.
Why wait: Stop at 34.207. If it fails right after the breakout or closes below the 20d MA on volume, I am out before the hard stop.
XOM · Base breakout · R/R 4.31:1

| Metric | Value |
|---|---|
| Buy Point | $174.19 |
| Stop | $164.089 (-6%) |
| Target | $217.74 (+25%) |
| R/R | 4.31 : 1 |
| Status | IMMINENT (-2.8% from buy) |
| Pattern | Base breakout |
| Sources | TREND2M+TREND1M |
Why now: XOM shows a Base breakout with buy point at 174.19. R/R 4.31:1 against a 164.089 stop.
Why wait: I need to see XOM actually trade through 174.19 with conviction — meaning volume that confirms institutional accumulation, not a drift through on light tape. The 0.865 volume ratio tells me the stock hasn't yet earned the right to be bought. I also need the RS number. If XOM is lagging the market, this breakout has a much higher failure rate regardless of how pretty the base looks. Energy names can be late-cycle laggards, and I don't want to be the last one holding the bag. My batting average matters more than my slugging percentage — I'd rather pass on a questionable setup and keep my capital intact for an A-plus pivot with confirmed volume and top-tier RS. If XOM clears 174.19 on 1.5x or better volume and shows me it's an RS leader, I'm in with a tight stop at 164.09 and I let the 4.31 RR work. Until then, I sit on my hands. The market pays patience, not anticipation.
CNC · Base breakout · R/R 4.23:1

| Metric | Value |
|---|---|
| Buy Point | $69.73 |
| Stop | $65.6125 (-6%) |
| Target | $87.16 (+25%) |
| R/R | 4.23 : 1 |
| Status | IMMINENT (-2.97% from buy) |
| Pattern | Base breakout |
| Sources | TREND4M+POWERPLAY |
Why now: CNC shows a Base breakout with buy point at 69.73. R/R 4.23:1 against a 65.6125 stop.
Why wait: Stop at 65.6125. If it fails right after the breakout or closes below the 20d MA on volume, I am out before the hard stop.
FANG · Base breakout · R/R 4.19:1

| Metric | Value |
|---|---|
| Buy Point | $217.0 |
| Stop | $204.0557 (-6%) |
| Target | $271.25 (+25%) |
| R/R | 4.19 : 1 |
| Status | IMMINENT (-2.52% from buy) |
| Pattern | Base breakout |
| Sources | TREND4M |
Why now: FANG is setting up in a proper base with a pivot at 217, and the structure is tight enough that I'm willing to lean in. The reward-to-risk here is 4.19 to 1, which is exactly the kind of asymmetry I want — I'm risking roughly 6% to make over 25%, and that math works even if my batting average dips. Volume at 1.097 is showing some pickup, not explosive yet, but the pattern is coiling and the breakout is imminent. When a stock is this close to the pivot and the base has held together, you don't wait for the crowd to confirm it — you act at the exact point, not before and not after. My stop at 204.05 is defined, it's tight relative to the base, and that's what lets me take the shot.
Why wait: The one thing giving me pause is that RS is unmarked — I don't have relative strength confirmation, and I never buy a breakout without knowing the stock is outperforming the market. Volume at 1.097 is decent but I'd prefer to see it expand meaningfully above average on the actual breakout day, not just creep up. If FANG clears 217 on weak volume or the general market is under distribution, this could be a false move that knocks me out at my stop. I'd rather miss the first few cents of the move and buy the confirmed breakout with volume behind it than get shaken out on a low-quality push. The setup is good, but I want the tape to tell me it's real before I commit size.
TEVA · Base breakout · R/R 4.11:1

| Metric | Value |
|---|---|
| Buy Point | $39.55 |
| Stop | $37.1411 (-6%) |
| Target | $49.44 (+25%) |
| R/R | 4.11 : 1 |
| Status | IMMINENT (-0.76% from buy) |
| Pattern | Base breakout |
| Sources | TREND4M+TREND2M+TREND1M |
Why now: TEVA shows a Base breakout with buy point at 39.55. R/R 4.11:1 against a 37.1411 stop.
Why wait: Stop at 37.1411. If it fails right after the breakout or closes below the 20d MA on volume, I am out before the hard stop.
Watch List
| Symbol | Source | Note |
|---|---|---|
| PBF | ONEIL+TREND2M+TREND1M | building |
| CIB | TREND4M | building |
| THC | TREND4M | building |
| MRK | TREND2M+TREND1M | building |
| GEO | POWERPLAY | building |
| RCMT | POWERPLAY | building |
Avoid
| Symbol | Reason |
|---|---|
| AGPU | price < $15.0 |
| ANET | RS Rating 80+ for strong candidates |
| AYA | no pivot |
| CARE | Price trading above the 50-day moving average |
| CARL | 150-day moving average above the 200-day moving average |
| CDNA | no pivot |
| CHRD | no pivot |
| DELL | no pivot |
| DHT | no pivot |
| DINO | no pivot |
| DK | no pivot |
| ECO | no pivot |
| EDRY | no pivot |
| EQNR | no pivot |
| EVER | 150-day moving average above the 200-day moving average; 200-day moving average trending up for at least 1 month (pre |
| FRO | no pivot |
| GKOS | RS Rating 80+ for strong candidates |
| INSW | no pivot |
| IOT | 150-day moving average above the 200-day moving average; 200-day moving average trending up for at least 1 month (pre |
| KNSA | RS Rating 80+ for strong candidates |
What I’d Tell You
Risk first, always. Know your stop before you enter. Size from the stop, not from how much you want to make. If a stock violates after the breakout — closes below the 20-day, fails to follow through, shows heavy selling — do not wait for the hard stop. Act. The difference between a good trader and a great one is not the entries; it is the exits.
Stage, pattern and sentiment labels are generated by rule-based approximations (Weinstein stage analysis, Minervini trend template and heuristic pattern detection), not by precise technical analysis. Data as of September 16, 2026. For informational and educational purposes only — not investment advice. Always verify against primary sources before making any investment decision. SEPA-inspired system. VCP geometry is partially visual; the detector is a proxy. All thresholds are author calibration.
Discover more from CANSLIM Research
Subscribe to get the latest posts sent to your email.


