 Andrew@CANSLIM RESEARCH
The Index Looks Calm, But Fewer Stocks Carry It
The S&P 500 is still near its highs. But the rally is getting thin. Gains are concentrated in the Mag 7 while small caps and the rest of the market lag. When fewer stocks do the heavy lifting, the index can stay up for a while. But it becomes fragile if the leaders slip. The IWM closed at 288.89, up just 0.40%. That is a quiet warning sign. Breadth is not confirming the headline strength.

Inflation Refuses to Cooperate With the Fed
The bigger story is inflation and energy. Recent reports say inflation is sticky again. Headline prices are still above wage growth. Energy costs are pushing the Fed into a tough corner. Oil jumped after attacks tied to Saudi infrastructure and fresh Iran concerns. That feeds into inflation, margins, and consumer spending. Rate-hike odds for the 9/16 meeting jumped from 72% on Thursday to nearly 90% on Friday. The Fed looks boxed in. Cutting too soon risks credibility. Staying tight longer pressures rates and equity valuations.
The AI Trade Shows Cracks Beneath the Surface
AI still drives leadership. But several analysts warn the trade may be maturing. The online crowd is asking hard questions. Three AI giants called for slowing frontier development on the same day. More than 1,000 lab employees signed a petition for government intervention. The stated reason was safety. The crowd did not buy it. Four theories spread fast: regulatory capture, a scaling wall, cash-flow cover, and pre-IPO marketing. A rational minority said the real limit is electricity and production capacity. Trading views split. One camp says killing the only growth story will crush semis. The other says a slowdown helps software and application names that do not burn cash.
Momentum Names Diverge as the Crowd Hedges Lightly
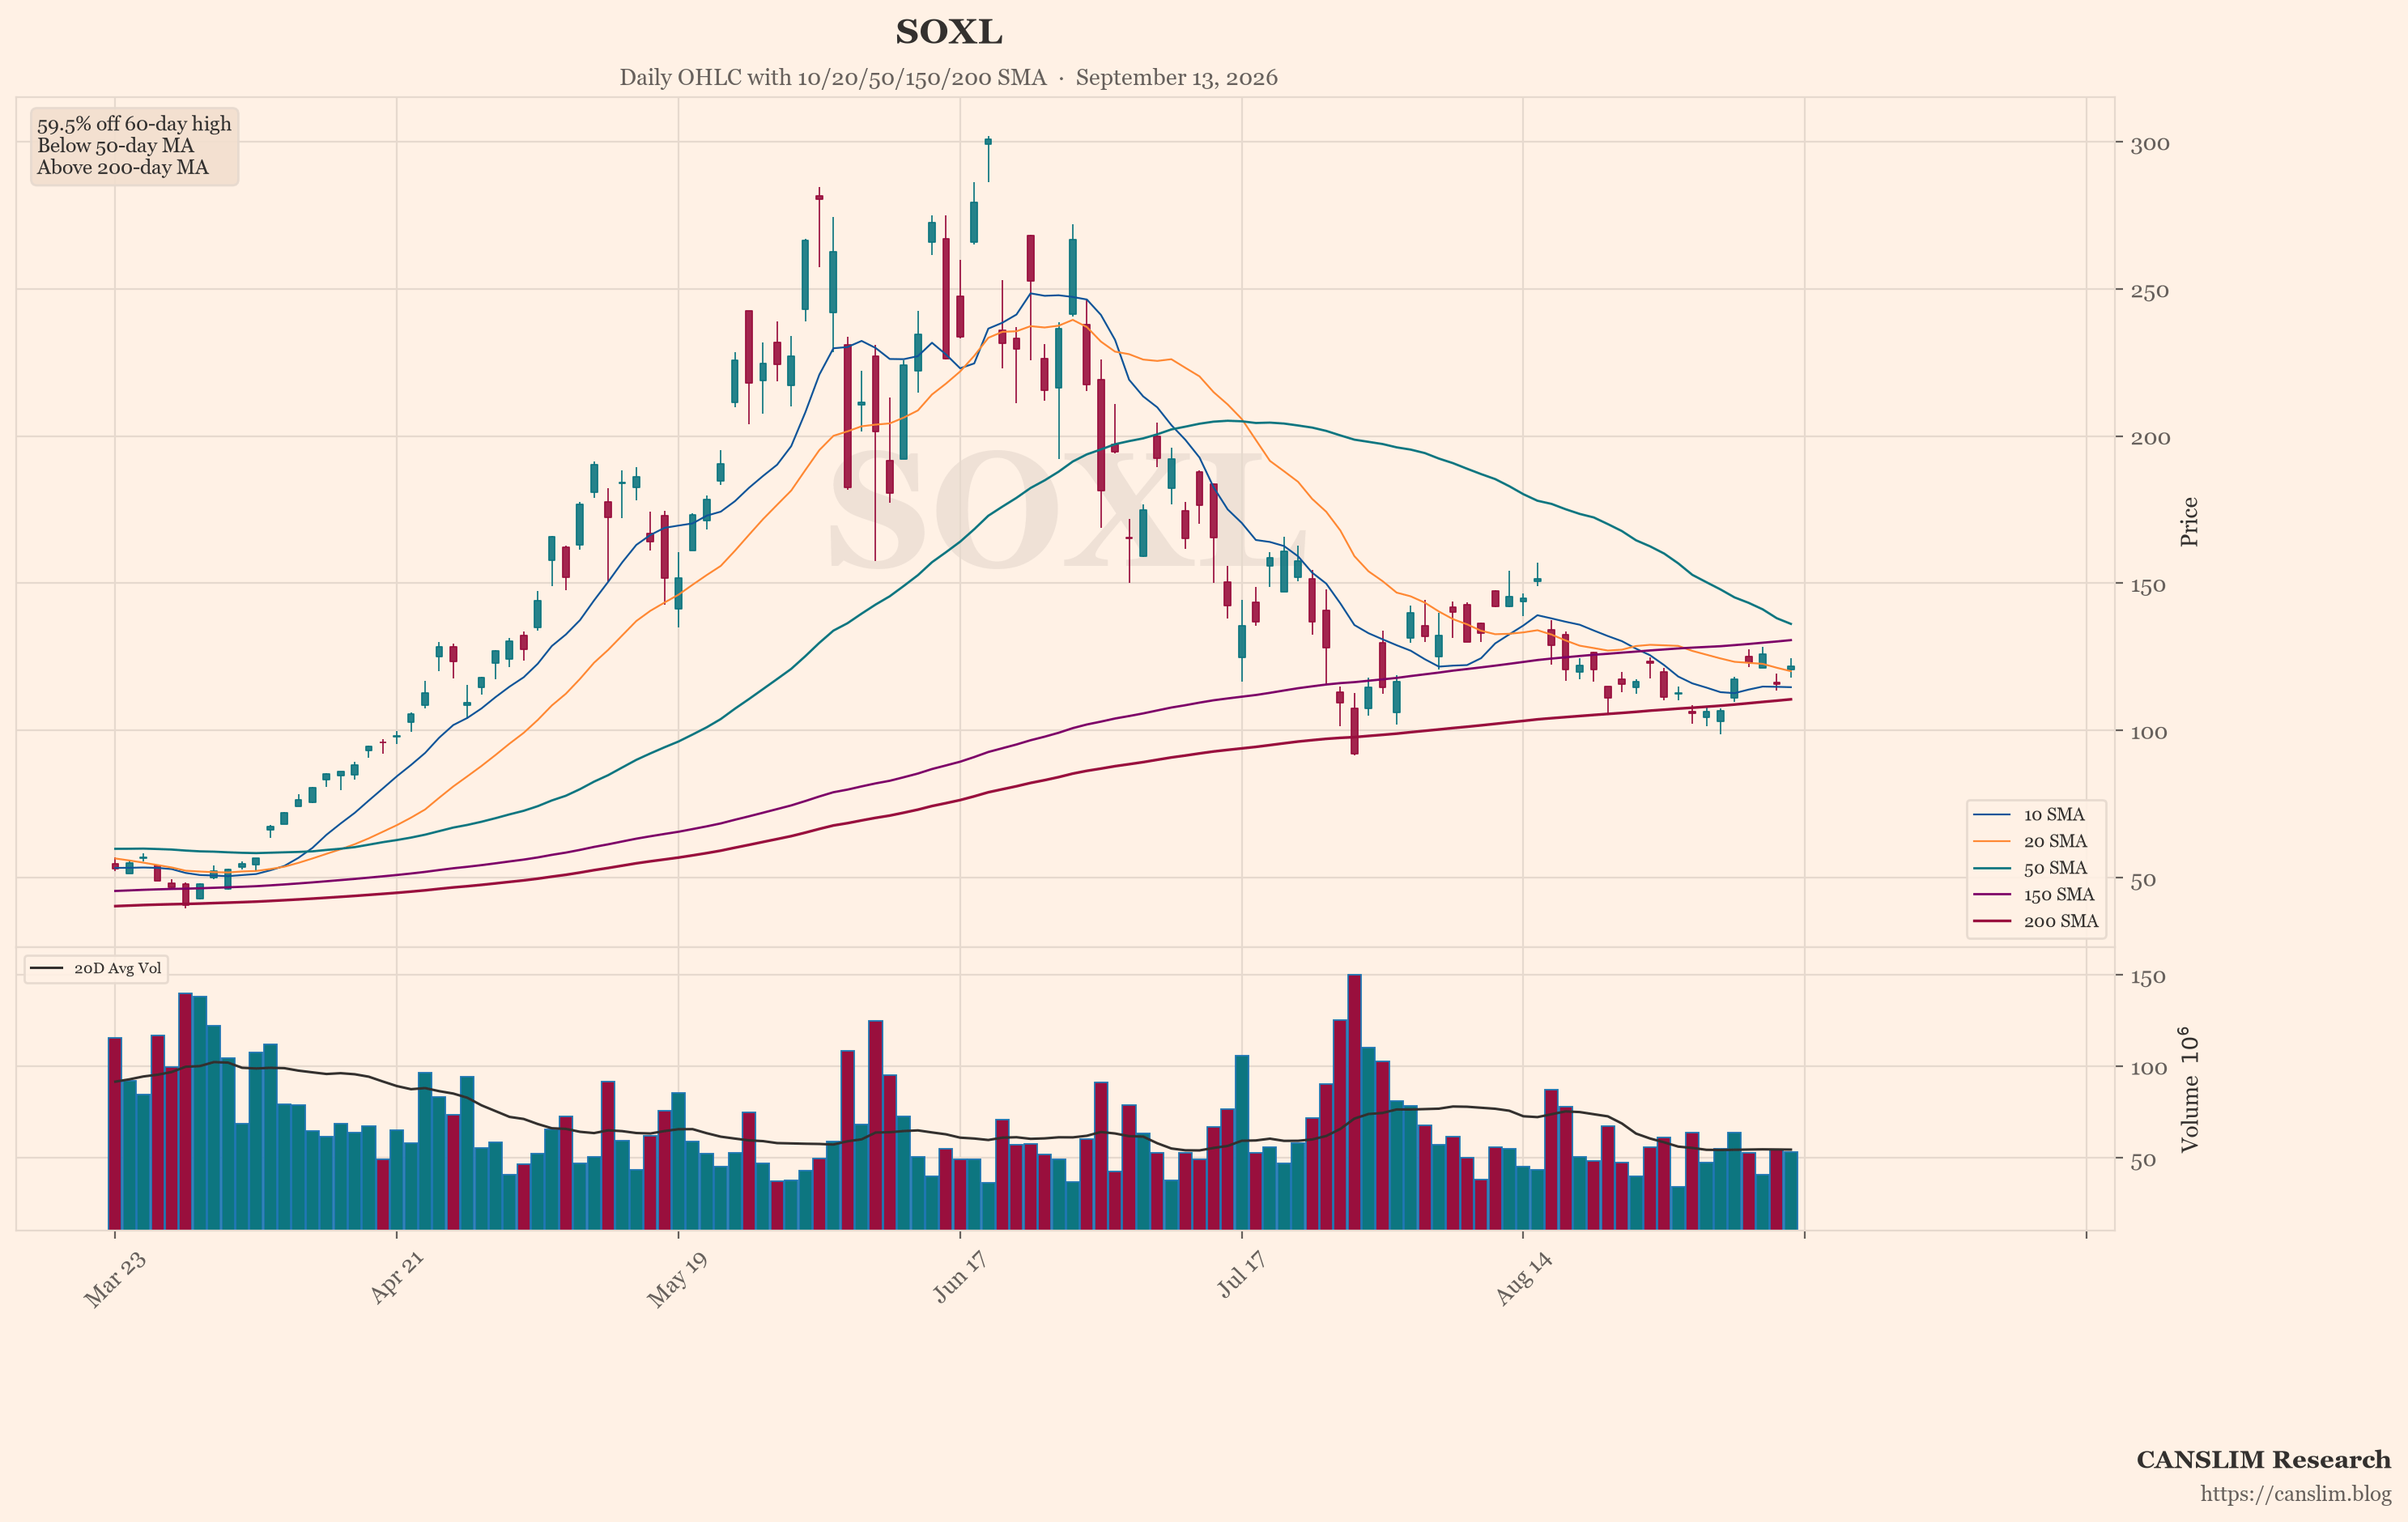
Friday’s tape was strange. The AI complex was strong even as the news turned cautious. DELL closed at 567.14, up 11.89% to an all-time high. SOXL rose 5.33%. AMD added 2.44%. INTC gained 2.66%. NVDA slipped just 0.09% to 218.17. But ORCL was violent. It opened at 164, plunged to 149.89, and closed at 150.30, down 1.81%. That erased its post-earnings gap. Ellison canceled a 50 million-share sale worth about $7.5 billion. Meanwhile, SPY closed at 764.14 (+0.83%), QQQ at 714.89 (+0.87%), and DIA at 525.79 (+0.94%).
The Fear Gauge Reads Low Quality
The fear/greed level sits near 30/100. That leans fearful. But the quality of that fear is low. Most of it is news-driven venting, not real positioning. Among comments describing actual trades, cash holders and SPY tail-risk puts at the 750/745 strikes dominate. One trader joked, “I went all-in on puts Friday, so the market is guaranteed to rise.” There is little evidence of systematic hedging. That matters. Light hedging means the crowd is not protected if breadth keeps narrowing.
SOXL Flashes the Weakest Technical Pattern
The featured chart is SOXL. It shows the weakest technical pattern right now. The fund tracks leveraged semis. It jumped 5.33% on Friday. But the move came on unstable ground. The AI slowdown debate threatens the group’s core narrative. Rate-hike odds near 90% pressure high-multiple names. If energy stays hot and the Fed leans hawkish, the rally keeps narrowing. If oil cools and yields settle, the market may broaden back out. Until then, selectivity beats owning the index. Watch the 9/16 Fed meeting, oil follow-through, and whether breadth gets worse. The tape is not risk-off. It is a market that demands stock-picking over passive exposure.
Sources: market news brief & global social sentiment data. Updated 2026-09-13 14:00 HKT. For educational purposes only — not investment advice.
Discover more from CANSLIM Research
Subscribe to get the latest posts sent to your email.