 Eben@CANSLIM Research
Institutional Analysis & Market Backdrop
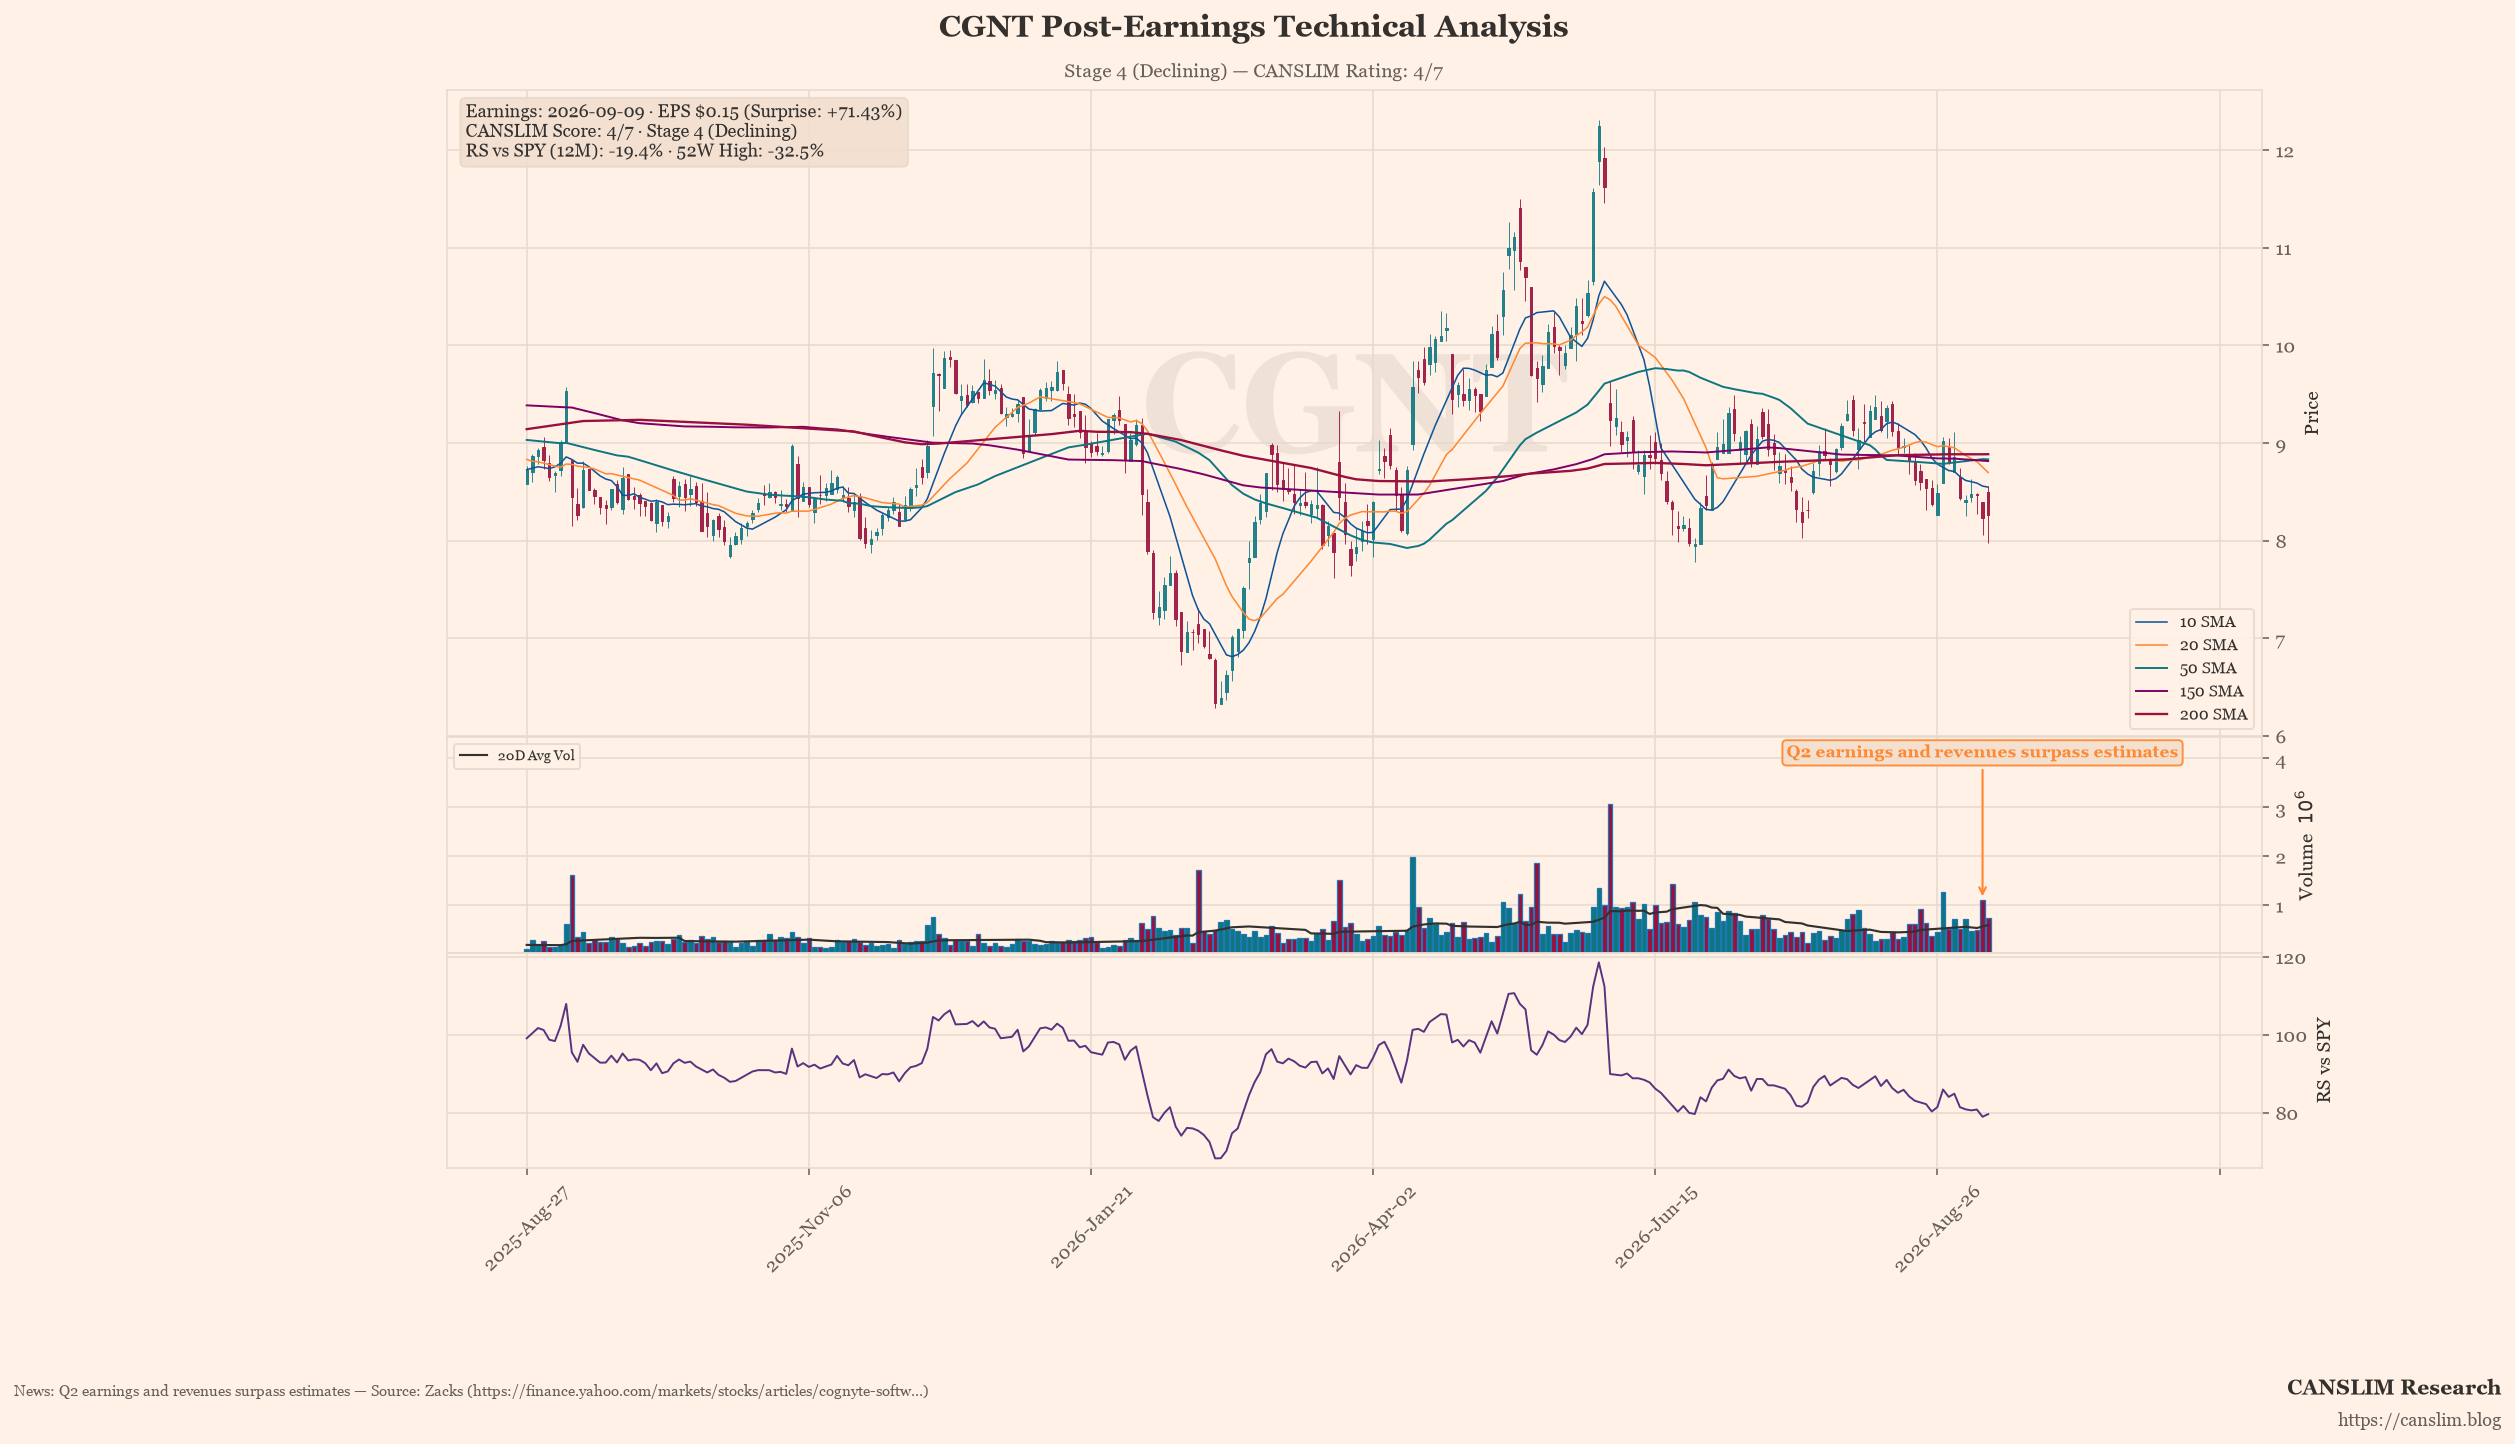
Cognizant Technology Solutions reported robust financial performance on 9 September 2026, with EPS of $0.15 significantly exceeding consensus estimates of $0.09—a staggering 71.43% surprise. Revenue grew year-on-year by 10.4%, indicating resilient demand across its core consulting and technology services divisions. This operational success suggests the firm is effectively navigating market headwinds, delivering value to shareholders despite broader sector volatility.
Technically, CGNT presents a challenging picture for immediate momentum traders. The current price of $8.26 sits below both the 50-day moving average at $8.83 and the 200-day moving average at $8.88, confirming its classification in Stage 4 (Declining). With a -32.5% drawdown from recent highs, the stock lacks upward momentum and faces significant resistance near these key support levels. While the CANSLIM score of 4/7 indicates solid fundamentals, the technical structure currently favours caution over aggressive accumulation.
Institutional investors should monitor for a potential reversal signal as the stock approaches critical support zones, though forward catalysts remain limited in the short term. Operational risks include continued exposure to cyclical IT spending and potential margin compression if client budgets tighten further. Until price action reclaims the 50-day moving average with volume, the prevailing trend remains bearish, suggesting a wait-and-see approach for new market entry.
Earnings & Quantitative Scorecard
| Key Metric | Reported / Current | Benchmark / Consensus | Status |
|---|---|---|---|
| Quarterly EPS (C) | $0.15 (+87% YoY) | $0.09 (Surprise: +71.4%) | Pass |
| Quarterly Revenue | $105.5M (+10.4% YoY) | Top-line Growth | Pass |
| Annual EPS Growth (A) | N/A | ≥25% Annual CAGR | Fail |
| 52-Week High Range (N) | -32.5% off high | Within 15% of High | Lagging |
| Relative Strength (L) | -19.4% vs SPY | Positive Alpha | Fail |
| Institutional Float (I) | 71% | 30% – 90% Float Ownership | Pass |
| Minervini Trend Template | 2 / 7 Criteria | Stage 2 Uptrend Alignment | Stage 4 (Declining) |
| Composite CANSLIM Rating | 4 / 7 Pillars | Institutional Quality Setup | 🟡 Developing / Watchlist |
Stage, pattern and sentiment labels are generated by rule-based approximations (Weinstein stage analysis, Minervini trend template and heuristic pattern detection), not by precise technical analysis. Data as of September 10, 2026. For informational and educational purposes only — not investment advice. Always verify against primary sources before making any investment decision.
Discover more from CANSLIM Research
Subscribe to get the latest posts sent to your email.