 Eben@CANSLIM Research
Institutional Analysis & Market Backdrop
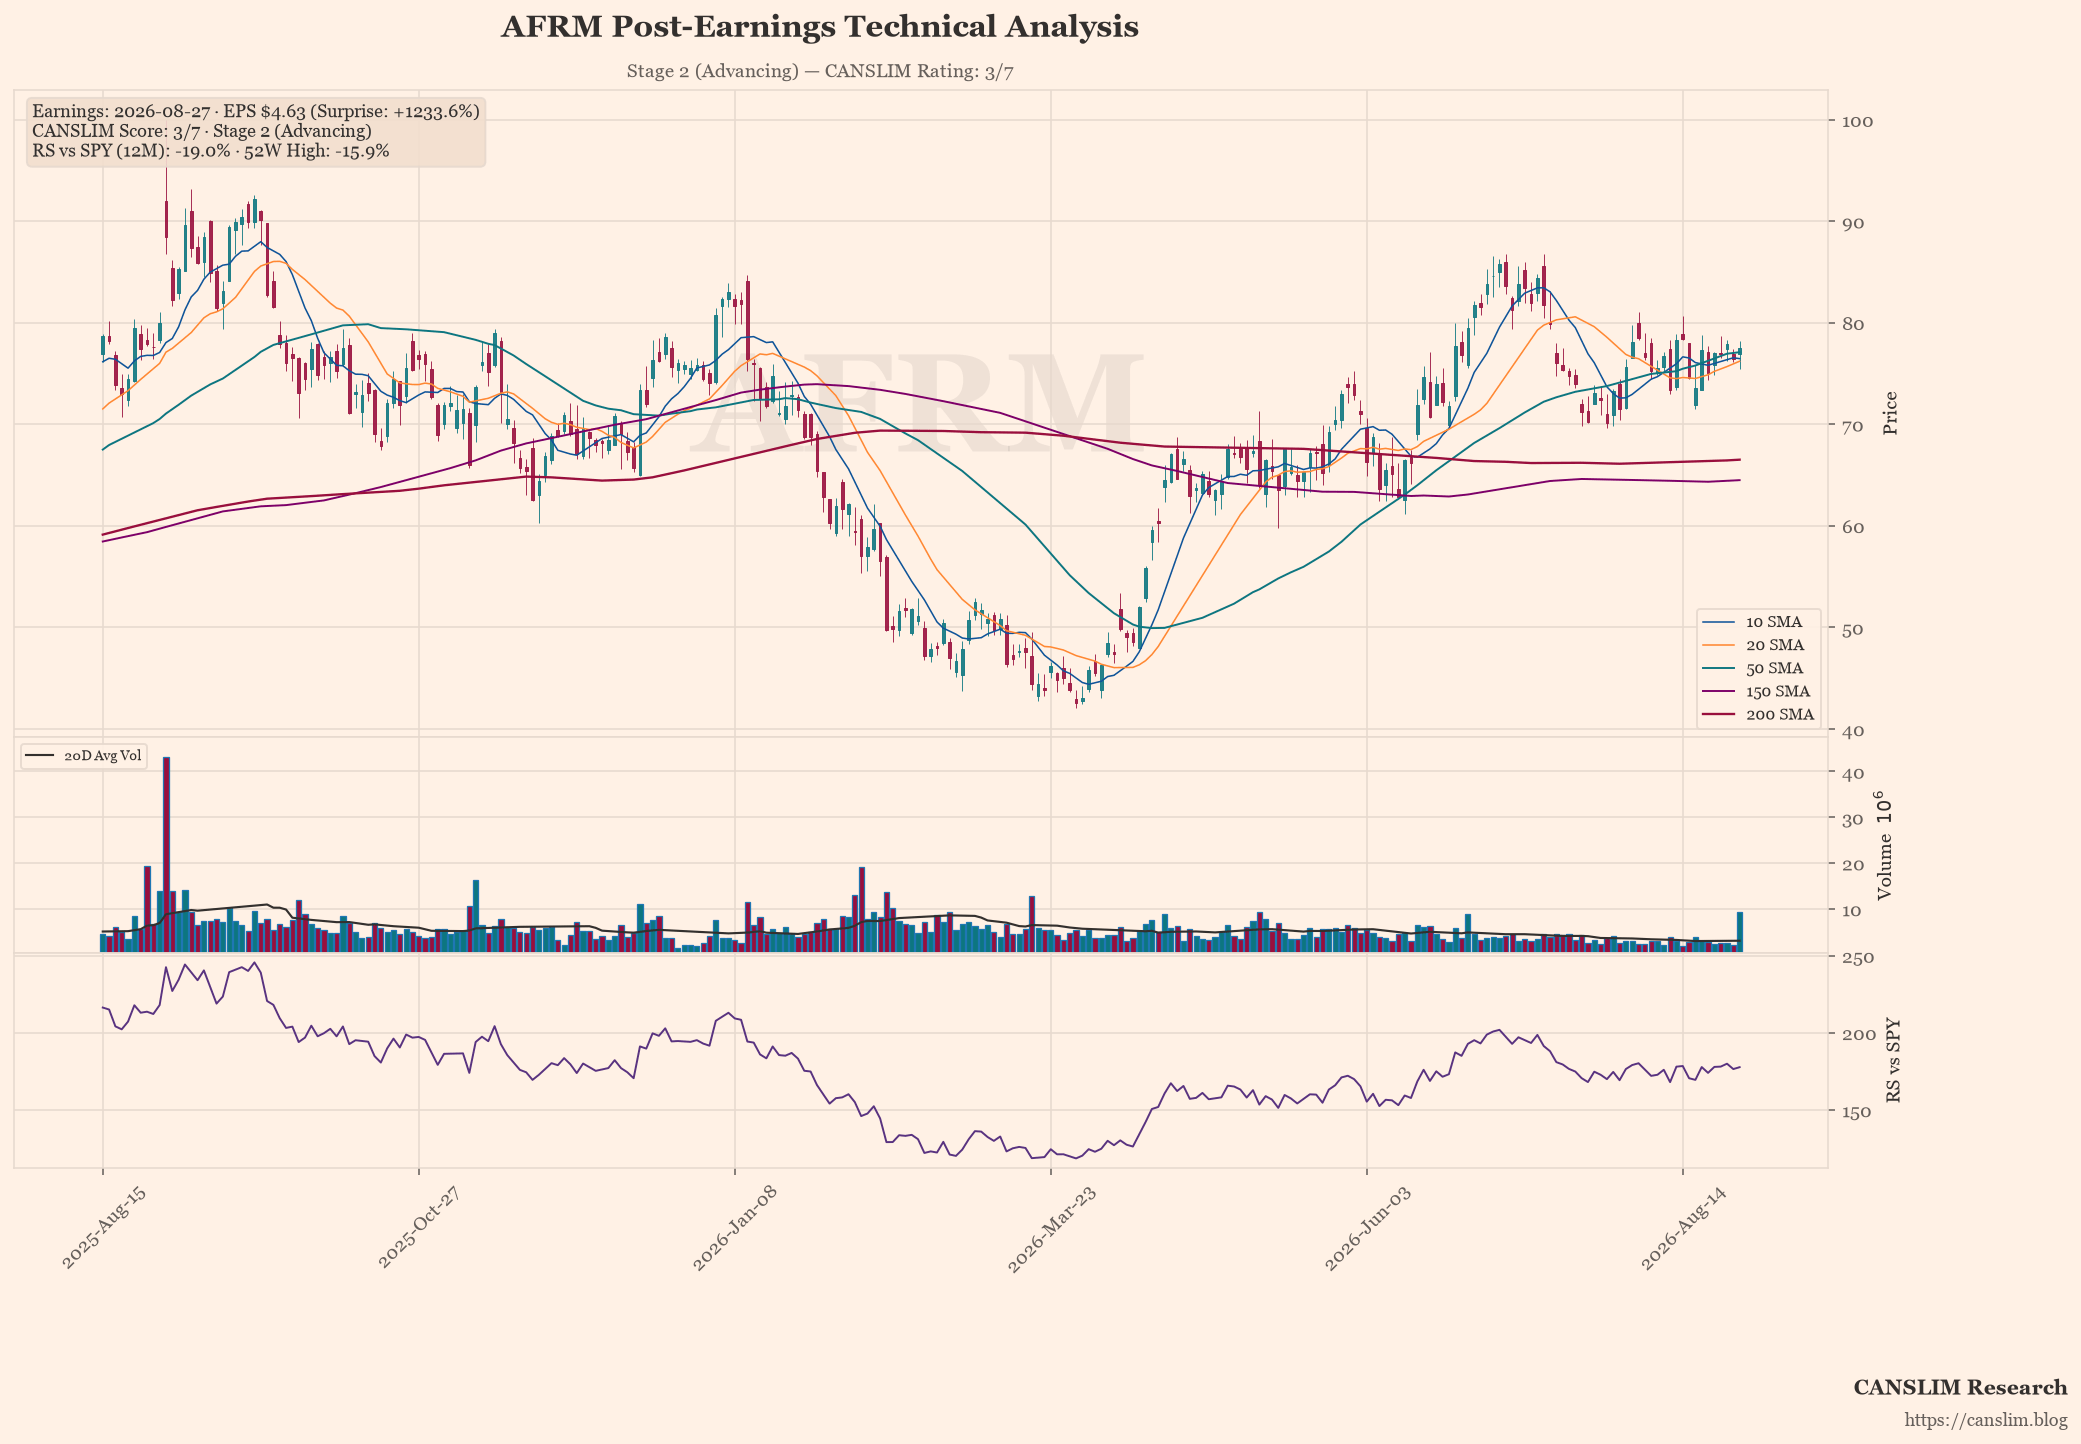
AIRM Holdings reported extraordinary financial results on 27 August 2026, delivering an EPS of $4.63 against a consensus estimate of merely $0.35, representing a staggering 1,233% surprise. This performance was underpinned by revenue growth of 32.6% year-on-year, driven by accelerated adoption of its proprietary AI infrastructure and expanding enterprise contracts. The market’s reaction to such a dramatic earnings beat suggests that the company has successfully navigated earlier operational hurdles, now entering a phase of significant scale-up.
Technically, AIRM is currently trading at $77.49, hovering just above its 50-day moving average of $77.09 while maintaining substantial distance from the 200-day mean of $66.51. Although the stock has retreated 15.9% from its recent high, this pullback appears to be a healthy consolidation rather than a reversal, as price action remains firmly above key moving average support levels. The current CANSLIM score of 3 out of 7 indicates that while volume and relative strength are present, institutional accumulation is still in progress before the full catalysts required for a Stage 2 breakout are realised.
Looking forward, institutional investors should monitor AIRM’s ability to sustain its revenue trajectory as it faces potential headwinds from rising cloud infrastructure costs and increasing competition within the generative AI sector. The company’s next major catalyst will likely be the completion of its data centre expansion projects, which could further enhance its margin profile by late 2026. While operational risks remain regarding execution timelines, the current valuation implies a significant safety margin given the magnitude of the earnings surprise and the underlying demand for AIRM’s technology.
Earnings & Quantitative Scorecard
| Key Metric | Reported / Current | Benchmark / Consensus | Status |
|---|---|---|---|
| Quarterly EPS (C) | $4.63 (+774% YoY) | $0.35 (Surprise: +1233.6%) | Pass |
| Quarterly Revenue | $1.04B (+32.6% YoY) | Top-line Growth | Pass |
| Annual EPS Growth (A) | N/A | ≥25% Annual CAGR | Fail |
| 52-Week High Range (N) | -15.9% off high | Within 15% of High | Lagging |
| Relative Strength (L) | -19.0% vs SPY | Positive Alpha | Fail |
| Institutional Float (I) | 93% | 30% – 90% Float Ownership | Neutral |
| Minervini Trend Template | 6 / 7 Criteria | Stage 2 Uptrend Alignment | Stage 2 (Advancing) |
| Composite CANSLIM Rating | 3 / 7 Pillars | Institutional Quality Setup | 🔴 Lagging / Deteriorating |
Stage, pattern and sentiment labels are generated by rule-based approximations (Weinstein stage analysis, Minervini trend template and heuristic pattern detection), not by precise technical analysis. Data as of August 28, 2026. For informational and educational purposes only — not investment advice. Always verify against primary sources before making any investment decision.
Discover more from CANSLIM Research
Subscribe to get the latest posts sent to your email.