 Eben@CANSLIM Research
Institutional Analysis & Market Backdrop
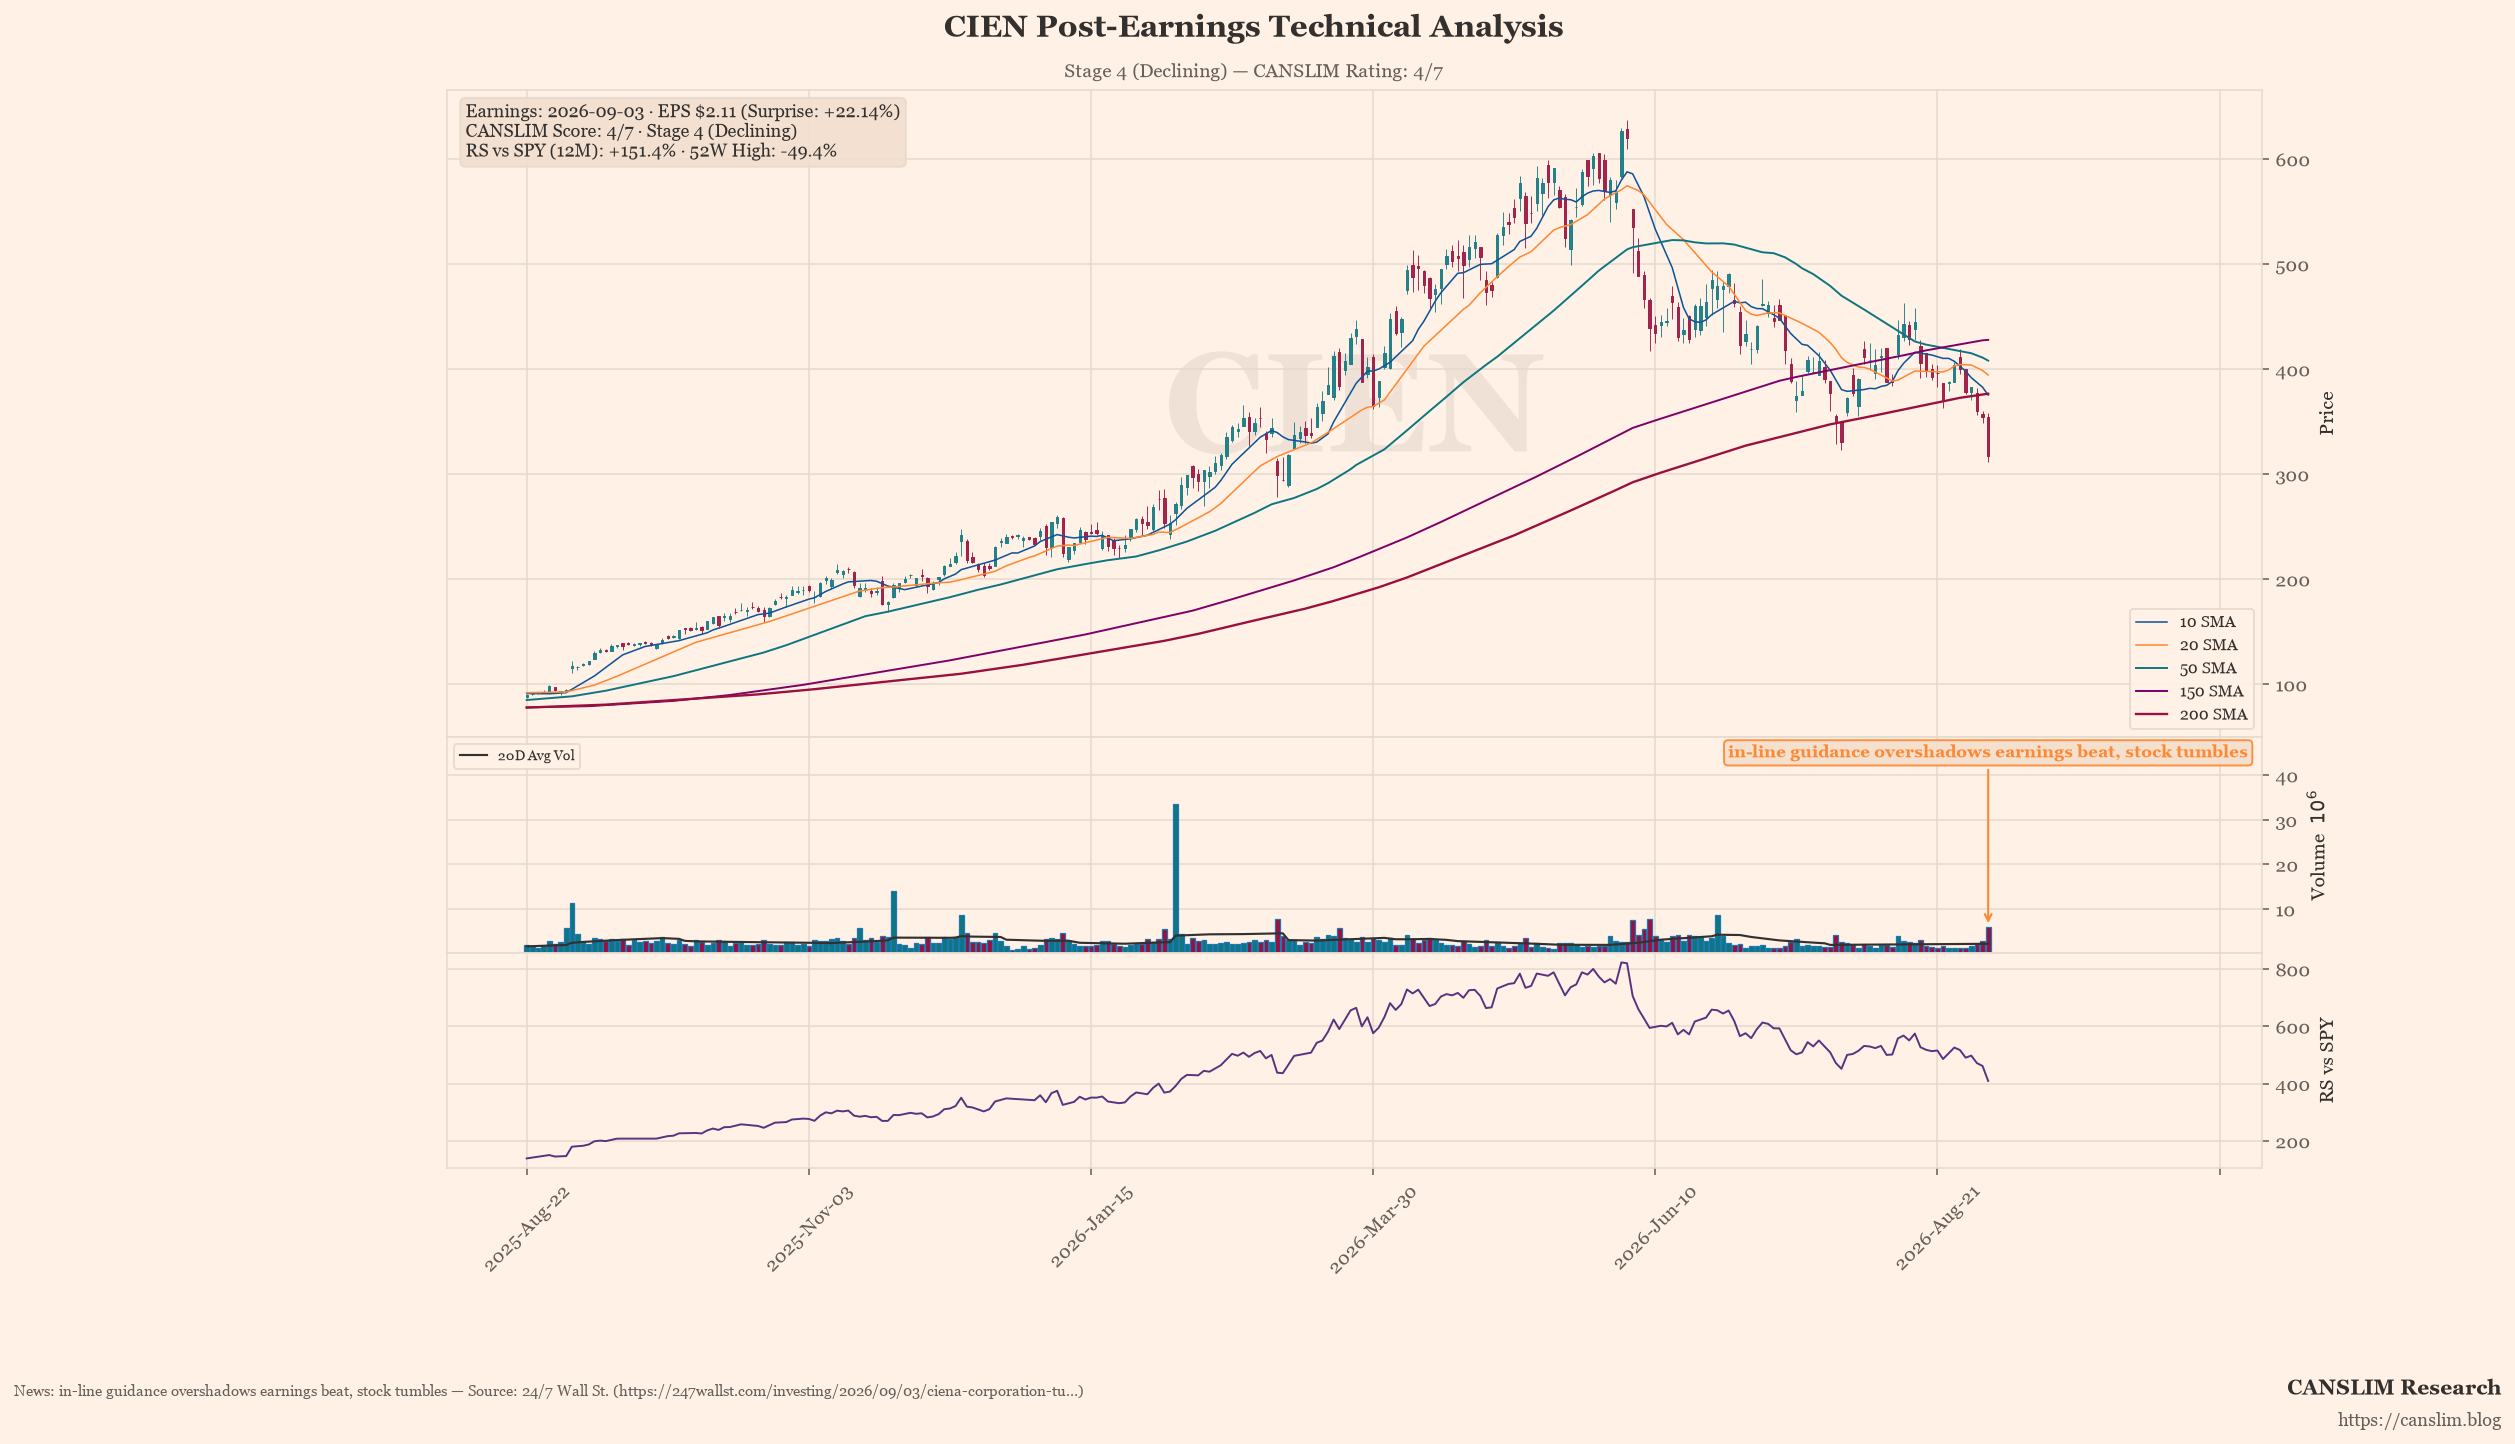
Ciena (CIEN) has announced financial results that significantly outperformed Wall Street expectations, posting earnings per share of $2.11 against a consensus estimate of $1.73—a remarkable 22.14% surprise. This robust performance was underpinned by revenue growth of nearly 40% year-on-year, reflecting the company’s continued success in capturing market share within the artificial intelligence infrastructure sector. The surge in demand for optical switching solutions has been a primary driver, demonstrating that operational fundamentals remain exceptionally strong despite broader market volatility.
From a technical perspective, however, the stock is currently in Stage 4 of its cycle, characterised by a pronounced decline. The current share price of approximately $317.52 sits significantly below both the 50-day moving average at $408 and the 200-day moving average at $376.52, indicating a loss of momentum and potential institutional selling pressure. With the stock down by nearly 50% from its recent highs, traders should exercise caution regarding immediate buy signals, as the price action suggests a prolonged correction rather than an imminent reversal.
Looking forward, CIEN’s outlook remains positive given the accelerating adoption of AI data centres, which will likely sustain revenue momentum in the coming quarters. Nevertheless, investors must remain vigilant for operational risks associated with supply chain constraints and potential margin compression from intense competition in the optical networking space. While the earnings beat provides a temporary reprieve, the technical structure currently dictates that the stock is vulnerable to further downside before any meaningful consolidation or recovery can occur.
Earnings & Quantitative Scorecard
| Key Metric | Reported / Current | Benchmark / Consensus | Status |
|---|---|---|---|
| Quarterly EPS (C) | $2.11 (+215% YoY) | $1.73 (Surprise: +22.1%) | Pass |
| Quarterly Revenue | $1.57B (+39.5% YoY) | Top-line Growth | Pass |
| Annual EPS Growth (A) | +-5%/yr | ≥25% Annual CAGR | Fail |
| 52-Week High Range (N) | -49.4% off high | Within 15% of High | Lagging |
| Relative Strength (L) | +151.4% vs SPY | Positive Alpha | Pass |
| Institutional Float (I) | 96% | 30% – 90% Float Ownership | Neutral |
| Minervini Trend Template | 3 / 7 Criteria | Stage 2 Uptrend Alignment | Stage 4 (Declining) |
| Composite CANSLIM Rating | 4 / 7 Pillars | Institutional Quality Setup | 🟡 Developing / Watchlist |
Stage, pattern and sentiment labels are generated by rule-based approximations (Weinstein stage analysis, Minervini trend template and heuristic pattern detection), not by precise technical analysis. Data as of September 04, 2026. For informational and educational purposes only — not investment advice. Always verify against primary sources before making any investment decision.
Discover more from CANSLIM Research
Subscribe to get the latest posts sent to your email.