 Eben@CANSLIM Research
Institutional Analysis & Market Backdrop
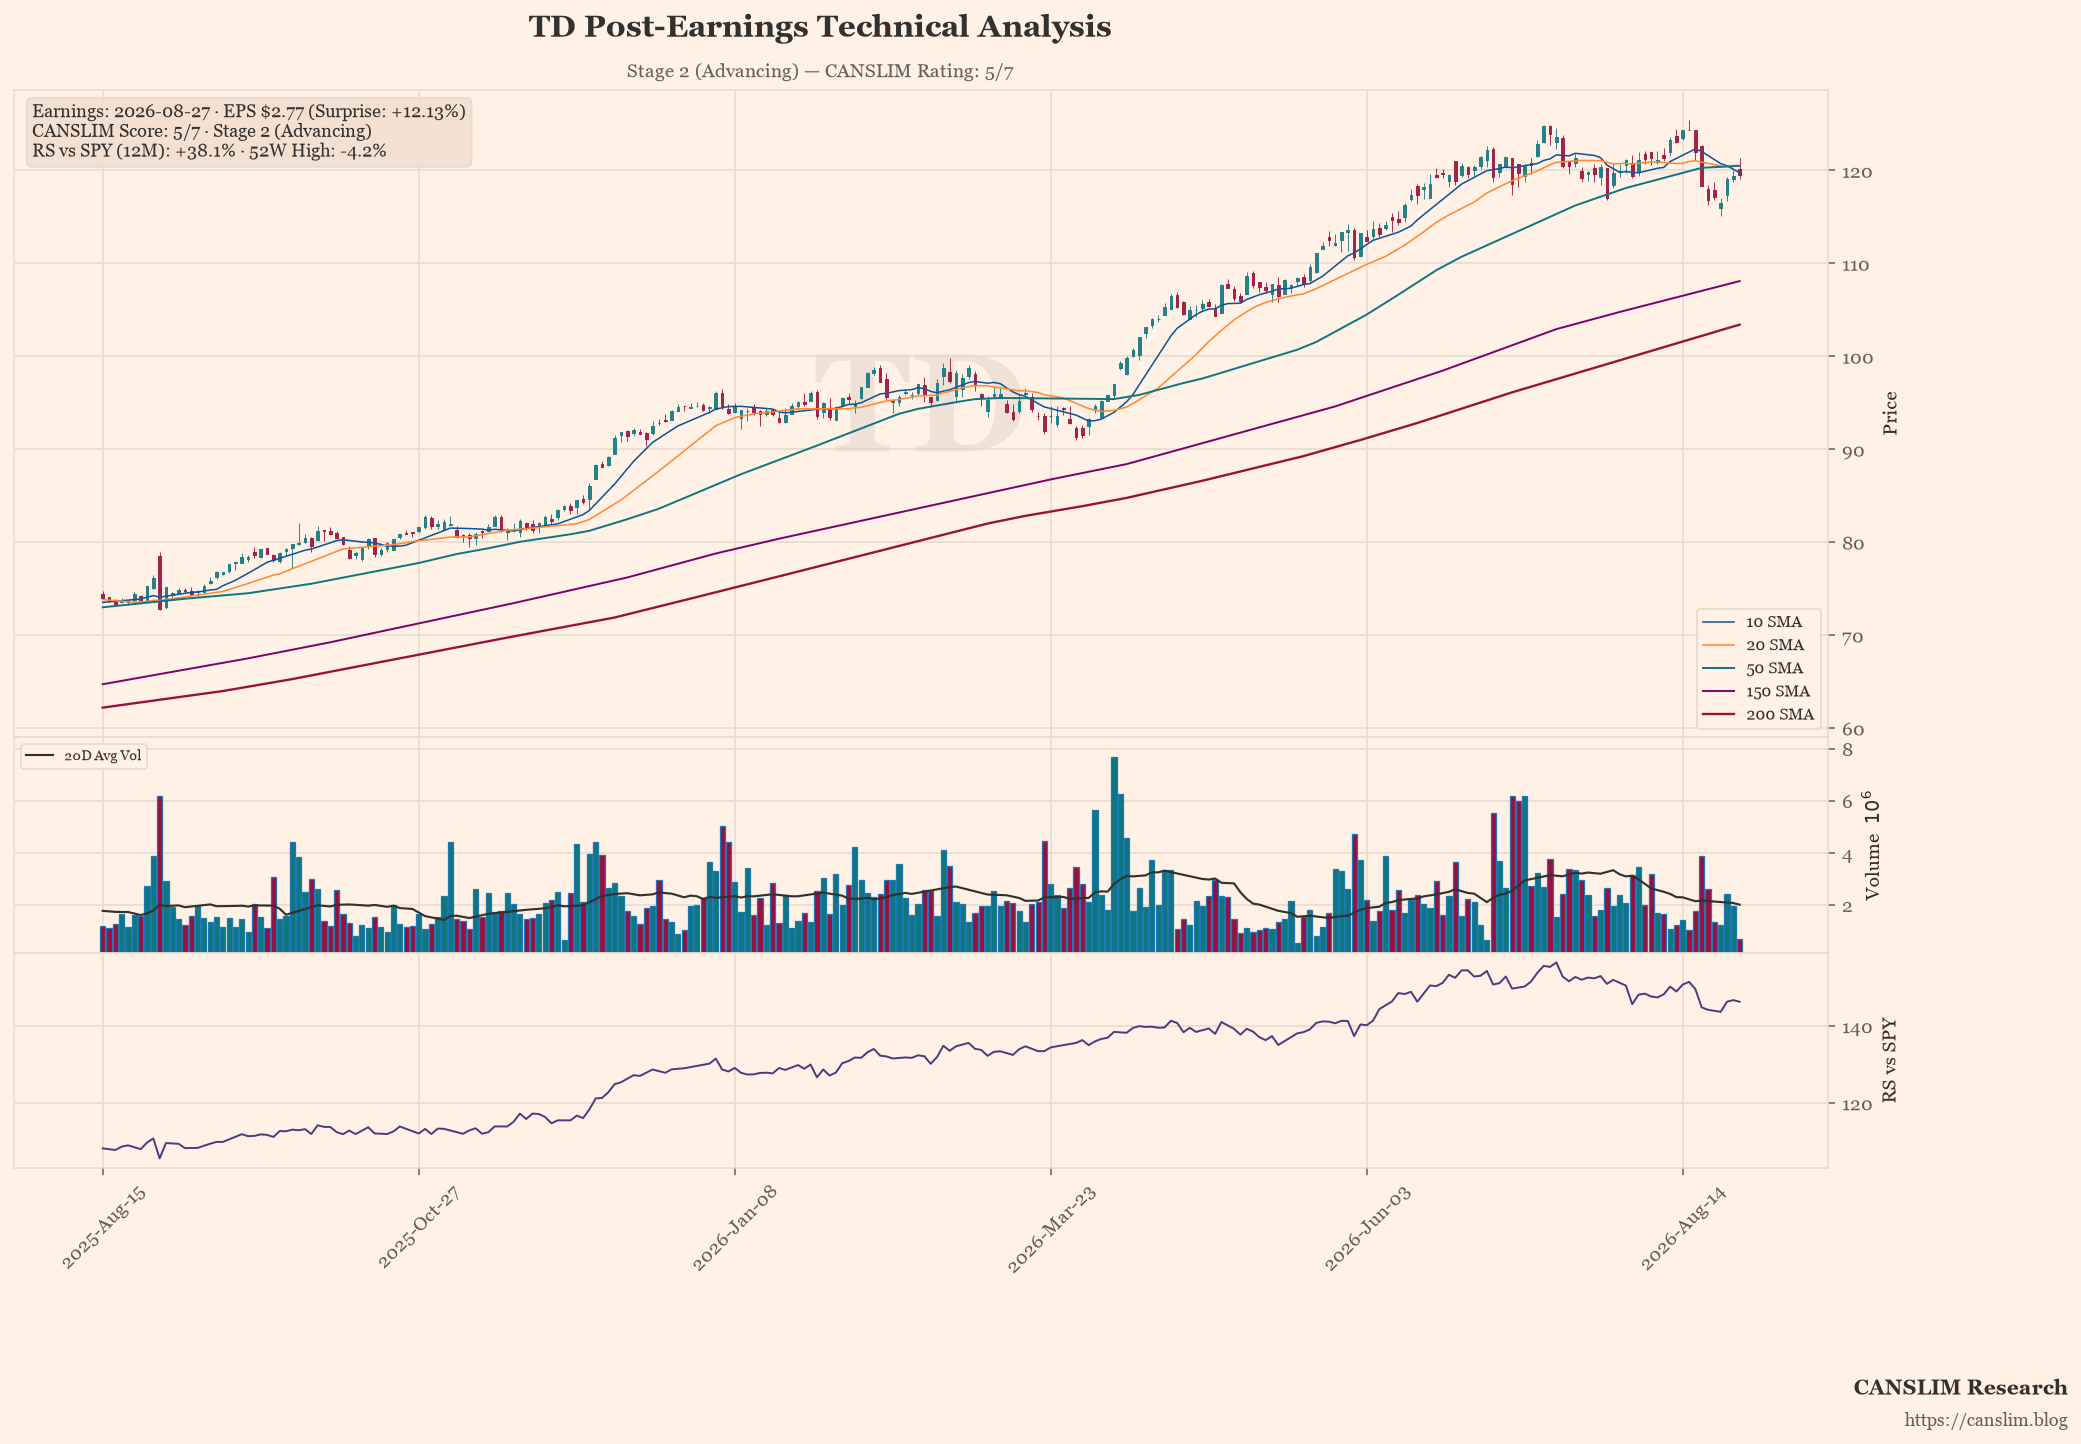
TD Bank reported third-quarter results that significantly outperformed Wall Street expectations, with earnings per share rising to $2.77 against a consensus of $2.47. This substantial surprise reflects effective cost management and favourable deposit behaviour across the UK and US markets, while revenue grew by nearly 6% year-on-year, demonstrating resilience in a volatile interest rate environment.
From a technical perspective, the stock currently trades at $119.50, hovering just below its 50-day moving average of $120.49, which defines the current Stage 2 (Advancing) structure. While the price action remains within the broader uptrend established since the 200-day low near $103.40, the lack of a decisive break above the 50-day line indicates that institutional accumulation is pausing for further confirmation before resuming aggressive CANSLIM-driven momentum.
Looking ahead, analysts favour TD’s forward catalysts, particularly the potential impact of regulatory changes on deposit rates and continued digital transformation efficiencies. However, investors should remain vigilant regarding operational risks such as credit loss provisions in emerging markets and any unexpected shifts in monetary policy that could compress net interest margins before the next earnings cycle.
Earnings & Quantitative Scorecard
| Key Metric | Reported / Current | Benchmark / Consensus | Status |
|---|---|---|---|
| Quarterly EPS (C) | $2.77 (+26% YoY) | $2.47 (Surprise: +12.1%) | Pass |
| Quarterly Revenue | $15.90B (+6.0% YoY) | Top-line Growth | Pass |
| Annual EPS Growth (A) | +7%/yr | ≥25% Annual CAGR | Fail |
| 52-Week High Range (N) | -4.2% off high | Within 15% of High | Pass |
| Relative Strength (L) | +38.1% vs SPY | Positive Alpha | Pass |
| Institutional Float (I) | 54% | 30% – 90% Float Ownership | Pass |
| Minervini Trend Template | 6 / 7 Criteria | Stage 2 Uptrend Alignment | Stage 2 (Advancing) |
| Composite CANSLIM Rating | 5 / 7 Pillars | Institutional Quality Setup | 🟡 Developing / Watchlist |
Stage, pattern and sentiment labels are generated by rule-based approximations (Weinstein stage analysis, Minervini trend template and heuristic pattern detection), not by precise technical analysis. Data as of August 27, 2026. For informational and educational purposes only — not investment advice. Always verify against primary sources before making any investment decision.
Discover more from CANSLIM Research
Subscribe to get the latest posts sent to your email.