 Eben@CANSLIM Research
Institutional Analysis & Market Backdrop
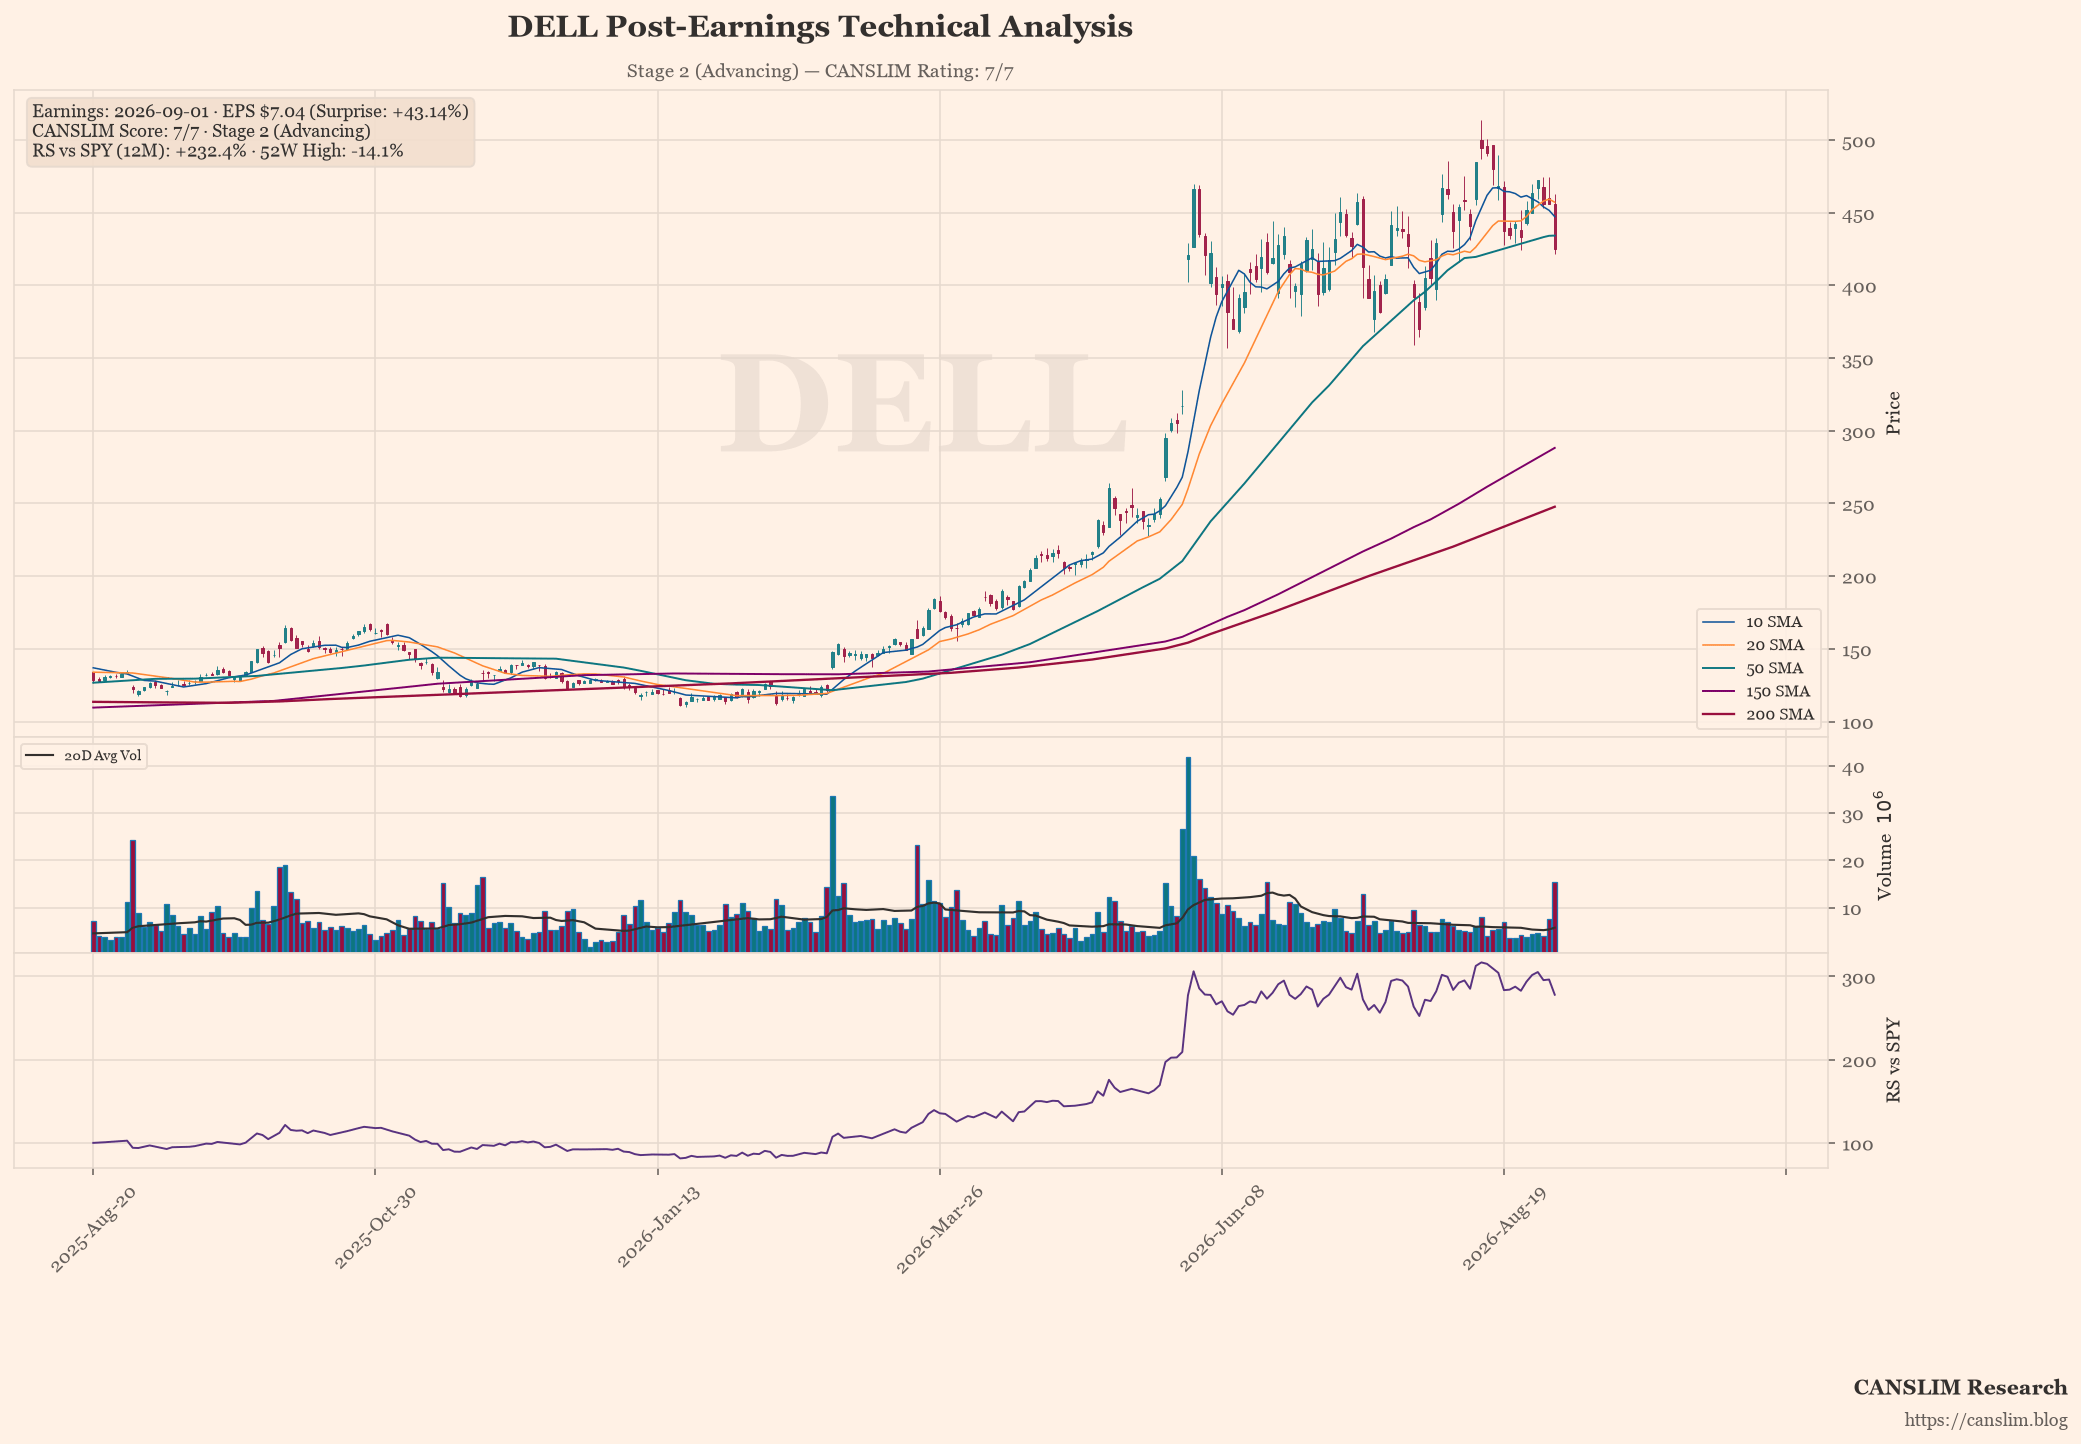
Dell Technologies has delivered an exceptional quarterly performance, reporting earnings per share of $7.04 against a consensus estimate of $4.92, representing a staggering 43% beat that significantly outperforms market expectations. Revenue growth accelerated dramatically year-on-year by 87.5%, driven primarily by robust demand in the enterprise and cloud infrastructure sectors which have favoured strong order backlogs. This level of earnings surprise suggests underlying operational efficiency is favouring margins, with cost management strategies paying dividends even as competitive pressures persist in the hardware market.
Technically, the stock remains structurally sound despite trading at $425.00, currently sitting below the 50-day moving average at $434.22 but well above the critical 200-day support level of $247.74. This configuration indicates a classic Stage 2 advancing trend where price consolidation precedes further upside expansion. The stock has achieved a perfect CANSLIM score of 7/7, signalling strong institutional alignment with growth criteria including relative strength and volume accumulation. While the recent -14% decline from its high represents healthy profit-taking rather than a breakdown, the broad technical structure continues to support bullish sentiment.
Looking ahead, institutional investors should favour Dell as a core holding given the forward catalysts embedded in its expanding cloud services portfolio and anticipated AI infrastructure spend. However, operational risks remain regarding potential supply chain disruptions and cyclical downturns in enterprise IT budgets that could temper growth rates in subsequent quarters. The market’s reaction to this earnings beat suggests confidence in management’s ability to navigate these headwinds, making the current valuation attractive for long-term capital appreciation strategies.
Earnings & Quantitative Scorecard
| Key Metric | Reported / Current | Benchmark / Consensus | Status |
|---|---|---|---|
| Quarterly EPS (C) | $7.04 (+203% YoY) | $4.92 (Surprise: +43.1%) | Pass |
| Quarterly Revenue | $43.84B (+87.5% YoY) | Top-line Growth | Pass |
| Annual EPS Growth (A) | +39%/yr | ≥25% Annual CAGR | Pass |
| 52-Week High Range (N) | -14.1% off high | Within 15% of High | Pass |
| Relative Strength (L) | +232.4% vs SPY | Positive Alpha | Pass |
| Institutional Float (I) | 76% | 30% – 90% Float Ownership | Pass |
| Minervini Trend Template | 6 / 7 Criteria | Stage 2 Uptrend Alignment | Stage 2 (Advancing) |
| Composite CANSLIM Rating | 7 / 7 Pillars | Institutional Quality Setup | 🟢 Strong Momentum Candidate |
Stage, pattern and sentiment labels are generated by rule-based approximations (Weinstein stage analysis, Minervini trend template and heuristic pattern detection), not by precise technical analysis. Data as of September 02, 2026. For informational and educational purposes only — not investment advice. Always verify against primary sources before making any investment decision.
Discover more from CANSLIM Research
Subscribe to get the latest posts sent to your email.