 Eben@CANSLIM Research
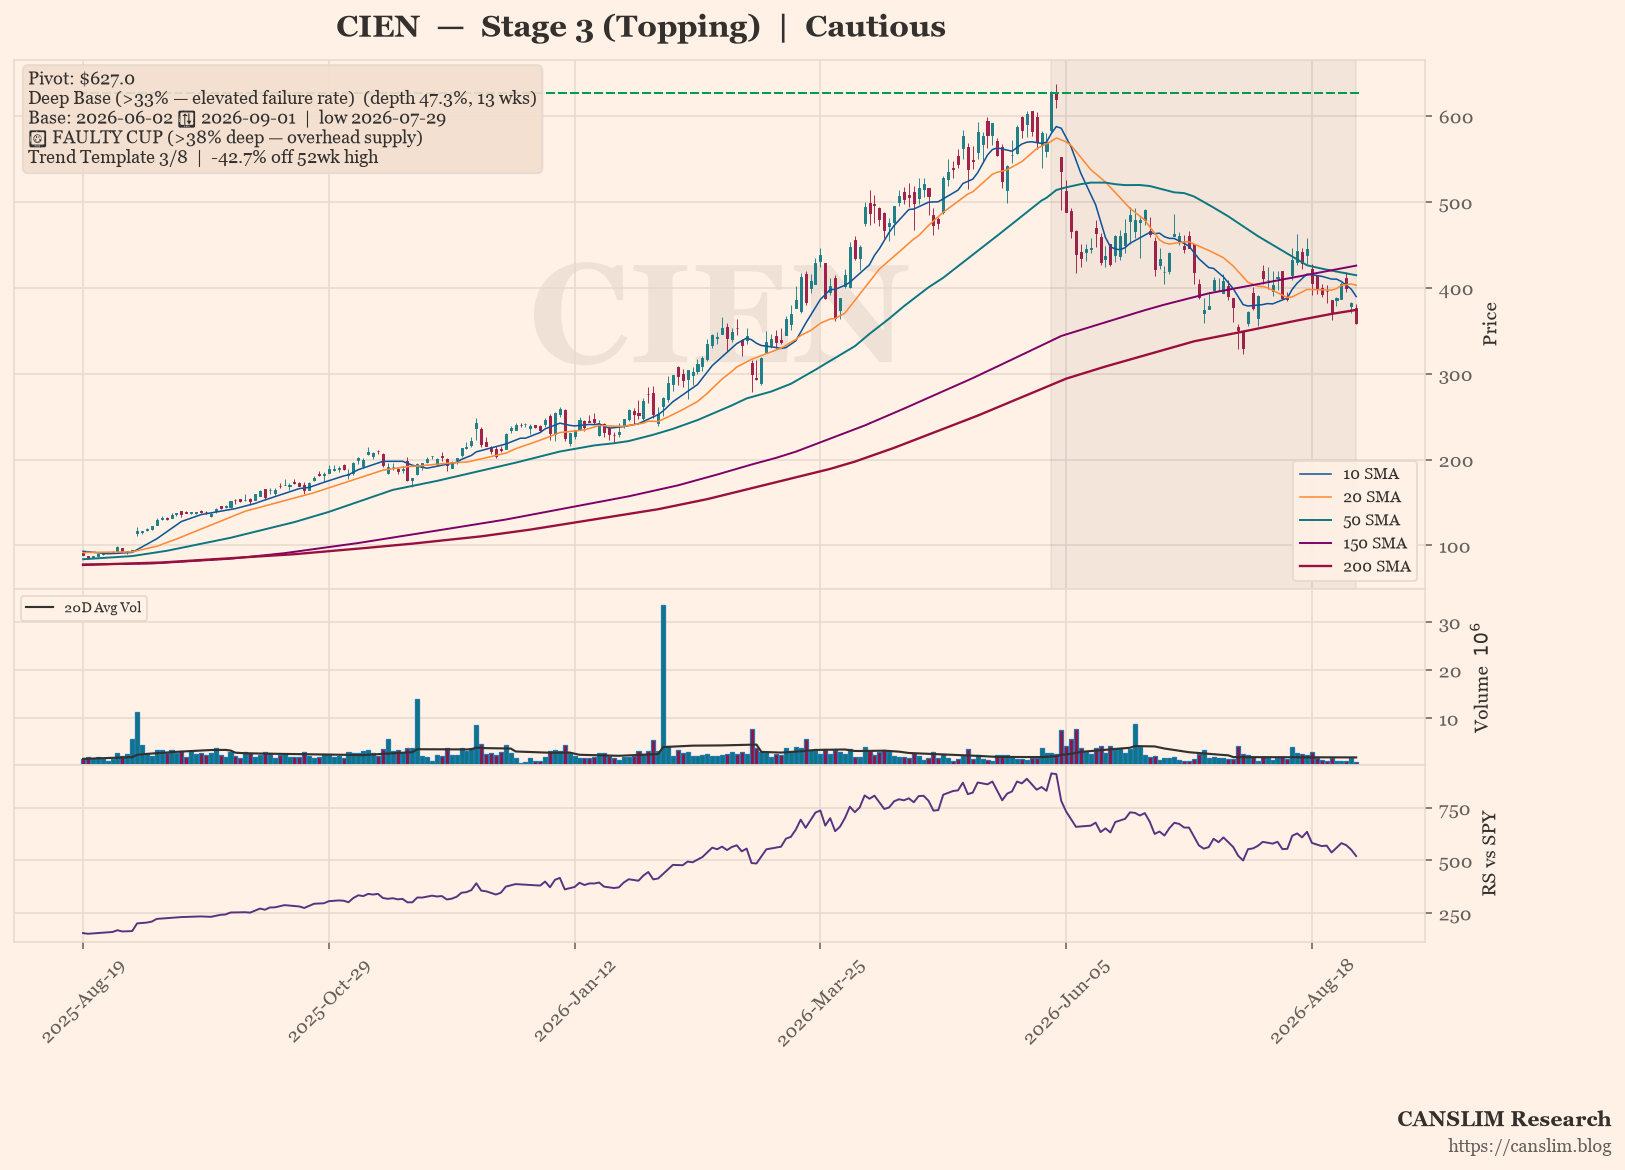
CIEN is forming a Stage 3 topping pattern, with price churning around the 30-week moving average after a 47.3% deep base that carries an elevated failure rate. The trend template shows only 3 of 8 checks passing, as the stock trades below its 50-, 150-, and 200-day moving averages and sits 42.7% below its 52-week high. Overall sentiment is cautious and deteriorating, with no VCP or flag structure detected to suggest an imminent breakout.
Technical Analysis
As of 2026-09-01 · Close $359.49
Stage Analysis
Stage 3 (Topping) — Price churning around the 30-week MA — topping consolidation (30-week MA 6-week slope: 6.27%)
Detected Patterns — What the Market Is Watching
- Deep Base (>33% — elevated failure rate) — depth 47.3%, length 13 weeks, pivot $627.0. Base formed from 2026-06-02 (left-side high) to 2026-09-01, with the low of $330.37 set on 2026-07-29
⚠️ Faulty cup warning: the base is 47.3% deep (above the 38–40% threshold). A correction this deep leaves heavy overhead supply — trapped holders from higher prices are likely to sell into any rally, raising the failure rate of a breakout from this base.

Subscribe to continue reading
Become a paid subscriber to get access to the rest of this post and other exclusive content.