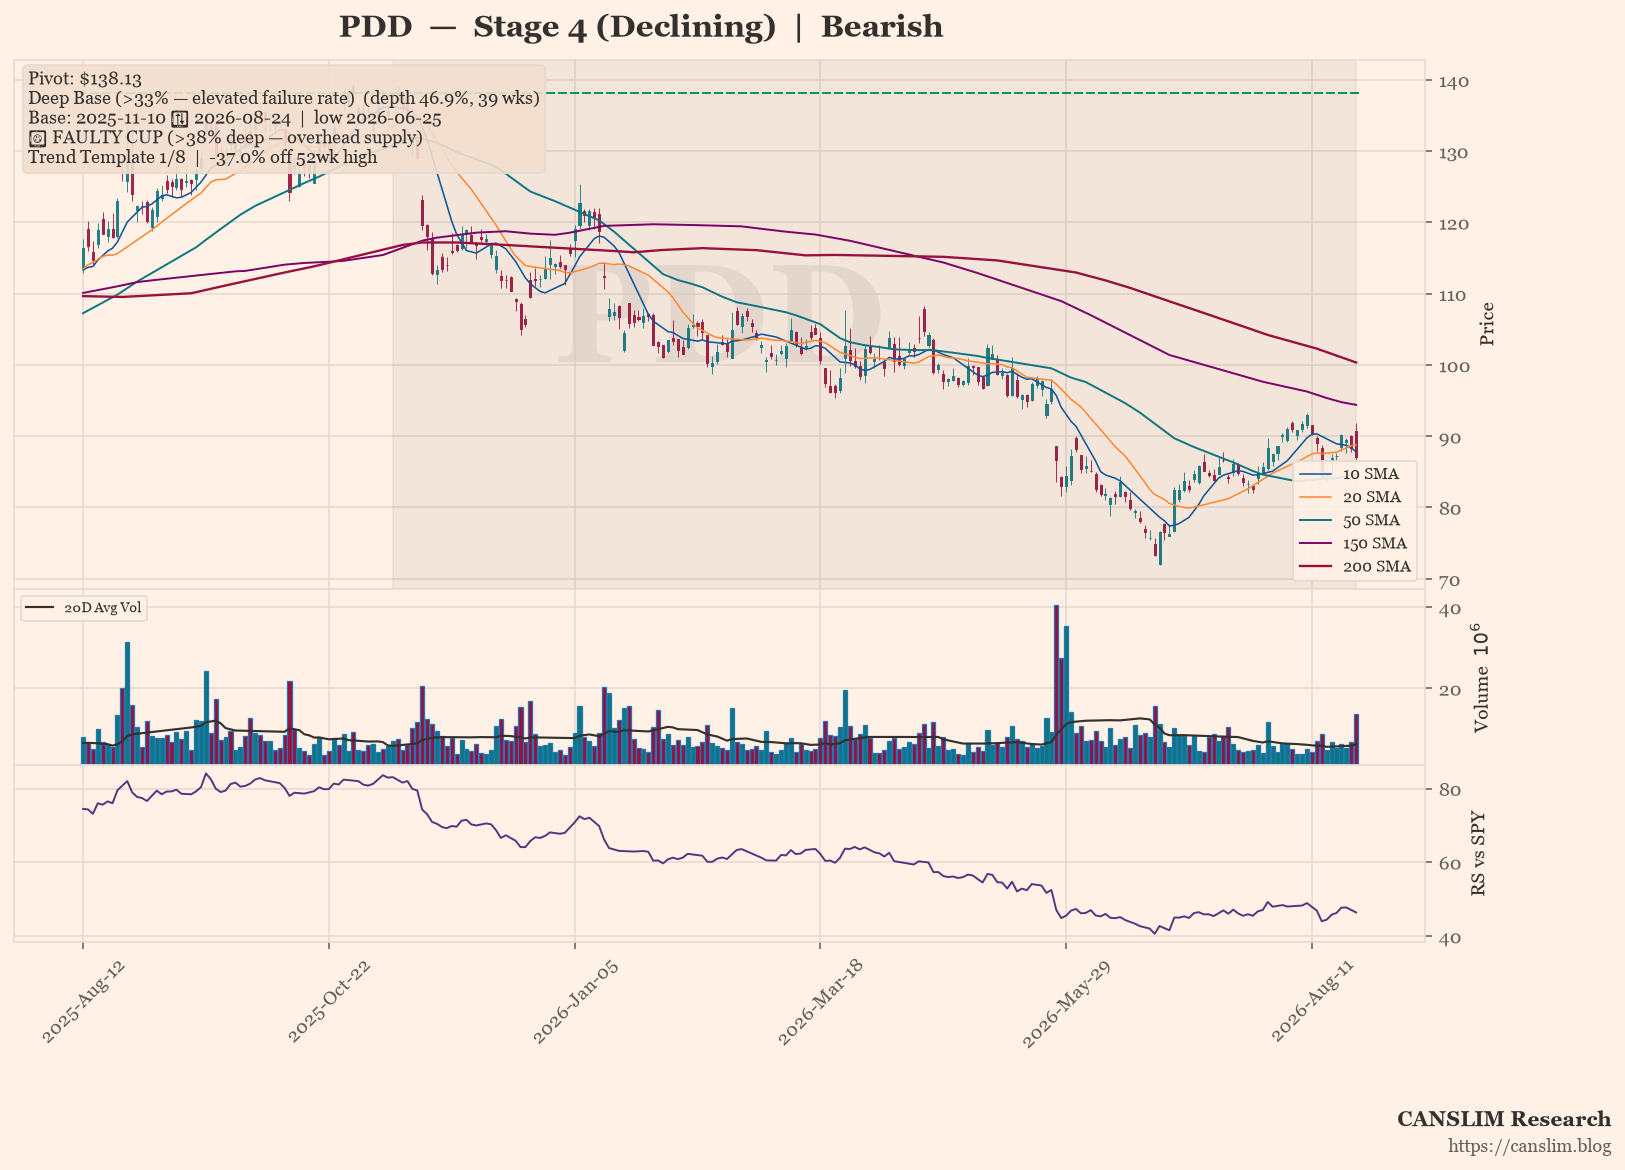
PDD remains entrenched in a Stage 4 downtrend, trading 37% below its high and beneath a declining 30-week moving average. The 39-week base is classified as a faulty deep pattern with a 46.9% depth, historically associated with elevated failure rates. With only one of eight trend-template checks passing and a bearish sentiment score of -8, the technical setup offers no actionable long entry and warrants a defensive stance.
As of 2026-08-24 · Close $87.07
Stage 4 (Declining) — Price below a declining 30-week MA — downtrend (30-week MA 6-week slope: -3.79%)
⚠️ Faulty cup warning: the base is 46.9% deep (above the 38–40% threshold). A correction this deep leaves heavy overhead supply — trapped holders from higher prices are likely to sell into any rally, raising the failure rate of a breakout from this base.
Continue Reading
This article is for pass holders.
30-Day Pass$12.00One-time purchase · no auto-renewalBuy 30 DaysSave $24.00
365-Day Pass$120.00
Already a pass holder? Sign in · Continue with Google